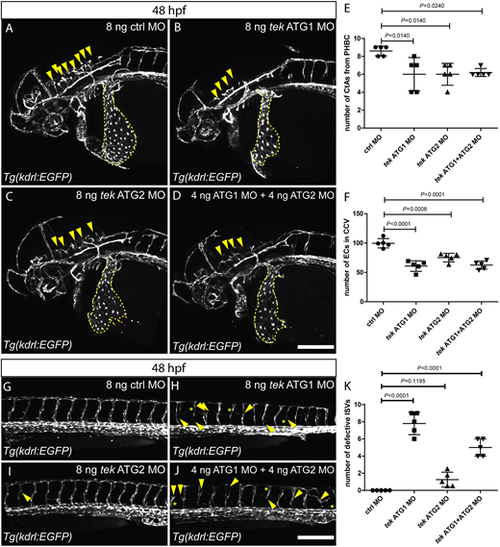
Zebrafish tek morphants display reduced angiogenesis and abnormal CCV formation. (A-D) Lateral views of 48 hpf head vasculature in embryos injected with 8 ng of control MO (A), 8 ng of tek ATG1 MO (B), 8 ng of tek ATG2 MO (C) or 4 ng of tek ATG1 MO plus 4 ng of tek ATG2 MO (D). Yellow arrowheads indicate central arteries (CtAs); yellow dashed lines outline the common cardinal veins (CCVs). (E) CtA numbers in different MO-injected groups at 48 hpf. (F) Endothelial cell numbers in the CCVs in different MO-injected groups at 48 hpf. (G-J) Lateral views of 48 hpf trunk vessels in embryos injected with 8 ng of control MO (G), 8 ng of tek ATG1 MO (H), 8 ng of tek ATG2 MO (I) or 4 ng of tek ATG1 MO plus 4 ng of tek ATG2 MO (J). Yellow arrowheads indicate abnormal intersegmental vessel (ISV) formation; yellow asterisks indicate absent ISVs. (K) Number of defective ISVs above the yolk extension in different MO-injected groups at 48 hpf. In E,F and K, data are mean�s.d. [one-way analysis of variance (ANOVA) followed by Tukey's HSD test]. Scale bars: 200 ?m.
|
