
Fig. 9-supplement 1
- ID
- ZDB-FIG-220526-28
- Publication
- Alhashem et al., 2022 - Notch controls the cell cycle to define leader versus follower identities during collective cell migration
- Other Figures
- All Figure Page
- Back to All Figure Page
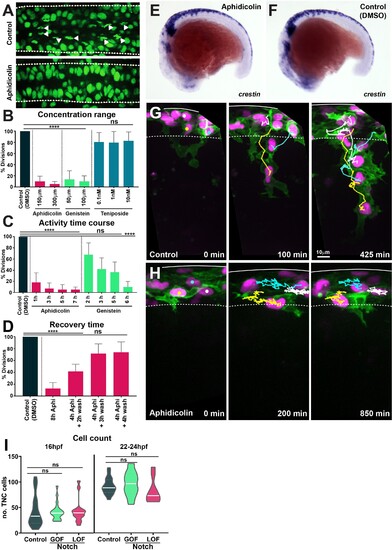
(A) Confocal images showing nuclei and mitotic figures in control (DMSO) and aphidicolin treated H2aFVA:H2a-GFP embryos. Arrowheads indicate mitotic figures; dashed lines mark the neural tube borders. Dorsal view, anterior to the left. (B) Percentage of mitotic figures in control (DMSO-treated embryos) and embryos treated with different concentrations of cell cycle inhibitors (Kruskal?Wallis test, p<0.0001, aphidicolin n = 20 and genistein n = 32; teniposide p>0.9999, n = 27). (C) Time course of the effect of cell cycle drugs (Kruskal?Wallis test, control vs. 1 hr aphidicolin p=0.0007; control vs. 3 hr, 5 hr, and 7 hr aphidicolin p<0.0001; control vs. 2 hr, 3 hr, and 5 hr genistein p>0.0892; control vs. 6 hr genistein p<0.0001; control n = 62 embryos; aphidicolin 1 hr n = 16, aphidicolin 3 hr n = 15, aphidicolin 5 hr n = 16, aphidicolin 7 hr n = 15; genistein 2 hr n = 15, genistein 3 hr n = 16, genistein 5 hr n = 17, genistein 6 hr n = 16). (D) Quantification of cell cycle recovery times following aphidicolin removal (control n = 21; aphidicolin 8 hr n = 18, aphidicolin 4 + 2 hr wash n = 15, 4 + 3 hr wash n = 15 and 4 + 4 hr wash n = 15 embryos; one-way ANOVA, control vs. 8 hr and 4 + 2 hr wash p<0.0001; control vs. 4 + 3 hr wash and 4 + 4 hr wash p>0.0851). (E, F) Whole-mount in situ hybridisation of the neural crest (NC) marker crestin in 16 hpf embryos upon (E) aphidicolin and (F) DMSO treatment from 12 hpf. Anterior to the left, dorsal top. (G, H) Selected frames of in vivo imaging from Sox10:mG embryos showing cell tracks under (G) control (DMSO) 16?28 hpf and (H) aphidicolin 16?33 hpf treatment. Solid line indicates the dorsal midline, dashed line the premigratory area; time in minutes. (I) Quantification of the number of trunk neural crest (TNC) cells per three migratory chains under control, Notch gain of function (GOF) and loss of function (LOF) conditions at either 16 hpf (control n = 25 embryos; GOF n = 21; LOF n = 14) and 22?24 hpf (control n = 18 embryos; GOF n = 18; LOF n = 9). Brown?Forsythe and Welch?s ANOVA tests, 16 hpf: control vs. GOF p>0.9999, control vs. LOF p=0.9976, GOF vs. LOF p=0.9942; 22?24 hpf: control vs. GOF p=0.8985, control vs. LOF p=0.5940, GOF vs. LOF p=0.3892.
|