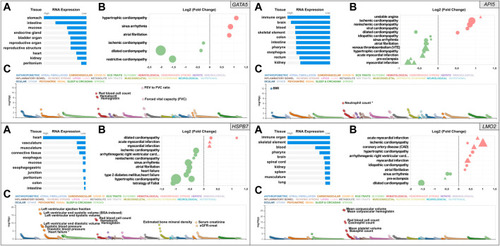
Snapshot of the results from the in silico assessment of the heart failure candidate genes API5 (top right), HSPB7 (bottom left), LMO2 (bottom right), and positive control gene GATA5 (top left panel). (A). The top 10 tissues showing expression based on RNA sequencing data from the Human Protein Atlas (HPA) and EMBL-EBI Expression Atlas as summarized by Open Targets Platform (https://www.targetvalidation.org). (B). Gene expression changes in cardiovascular disease conditions based on publicly available transcriptome studies from NCBI Gene Expression Omnibus (GEO). Disease conditions are shown on the Y-axis and log2 fold changes (vs. normal controls) on the X-axis. Icons are coloured by direction of change; red and green represent up- and downregulation in that disease, respectively. Icon shapes represent tissue type subjected to transcriptomics; circles and triangles represent heart and blood, respectively. Finally, icon size reflects statistical significance; the larger the icon the lower the p-value. All findings shown are significant (Adjusted p-value<0.05). (C). Common variant gene locus association data from 190 datasets and 251 traits in Common Metabolic Diseases Knowledge Portal (CMDKP). Traits considered genome-wide significant (p-value ≤ 5 × 10⁻⁸) are highlighted (border-line significant traits are marked with *).
|
