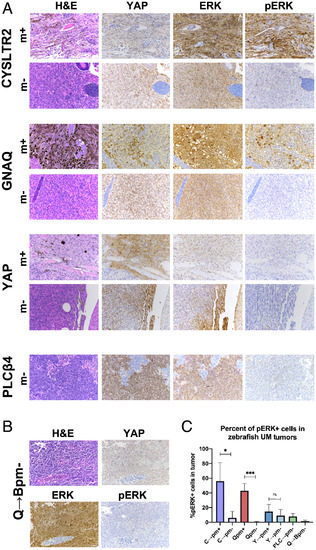
CYSLTR2L129Q-, YAPAA-, and PLC?4D630Y-driven tumors do not display hyperactive ERK staining in the mitfa?/? context. Genotype abbreviations are as described in Fig. 3. (A and B) Representative images of H&E staining and IHC for YAP, ERK, or phospho-ERK (pERK) on the indicated tumor genotypes. YAP activation is determined by nuclear localization and ERK activation by phospho-ERK. (A) C?pm+ tumors and Qpm+ tumors are positive for nuclear YAP and phospho-ERK, while C?pm?, Qpm?, and PLC?pm? tumors display only YAP activation; n ? 3 for all genotypes and stains, except n = 2 for each Y?pm? and C?pm+ IHC stains. (B) Q?Bpm? displays nuclear YAP but not phospho-ERK; n = 5 for all stains. (C) Graph shows the percent of UM tumor cells positive for phospho-ERK quantified by QuPath (n ? 3 for all genotypes, except n = 2 for Y?pm? and C?pm+), and error bars denote SD. Statistical significance is as follows: C?pm+ versus C?pm? P = 0.0435, Q?pm+ versus Q?pm? P = 0.0001, Y?pm+ versus Y?pm? P = 0.551, as determined by Student?s unpaired t test.
|
