
Fig. 9
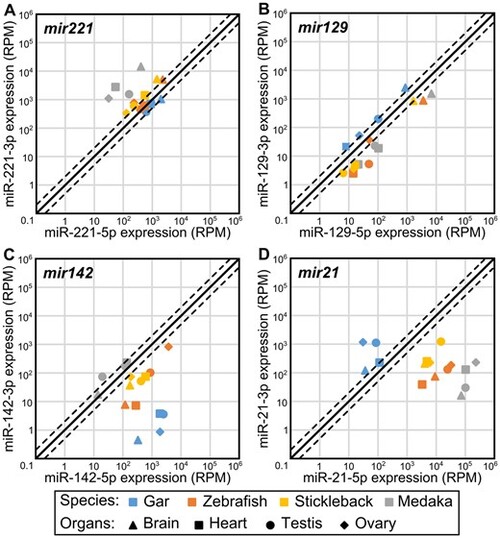
Examples of arm-switching events between species. Average expression of each strand in each organ is given in RPM (reads per million) on logarithmic scales for the four organs studied in gar, zebrafish, medaka, and stickleback. The solid line represents equal expression of 5p and 3p strands. Dashed lines represent 2-fold expression difference between one strand and the other. On each graph, points in the top-left half represent organs in which the 3p strand is more expressed than the 5p strand, and points in the bottom-right half represent organs in which the 5p strand is more expressed than the 3p strand. |