
Fig. 7
- ID
- ZDB-FIG-220415-11
- Publication
- Wen et al., 2021 - Fxr signaling and microbial metabolism of bile salts in the zebrafish intestine
- Other Figures
- All Figure Page
- Back to All Figure Page
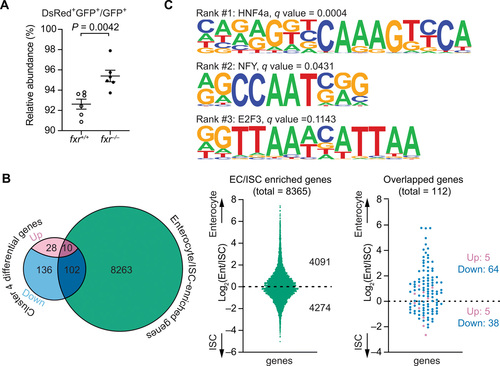
Fxr regulates differentiation and functions of anterior absorptive enterocytes in zebrafish.(A) FACS analysis comparing the relative abundance of anterior enterocytes in 7-dpf fxr+/+ and fxr?/? larvae expressing the Tg(-4.5fabp2:DsRed) and TgBAC(cldn15la-GFP) transgenes. The relative abundance was calculated by dividing the cell counts of DsRed+GFP+ double-positive cells by the cell counts of GFP+ single-positive cells (mean � SEM). Statistical significance was calculated by unpaired t test. Representative data from two independent experiments are shown. (B) Comparisons between the genes that were differentially expressed in fxr?/? cells relative to fxr+/+ cells in cluster 4 and the mouse genes enriched in jejunal enterocytes/intestinal stem cells (ISCs) (49). Left: Venn diagram showing the number of overlapped genes between the two gene sets, of which the differentially expressed genes in fxr?/? cells were further classified based on the changes in their expression (up- or down-regulated) upon fxr mutation. Middle: Distributions of enterocyte- and ISC-enriched genes from the enterocyte/ISC dataset used in the current comparison. Right: Distribution of overlapped genes resulting from the comparison. (C) Top 3 HOMER-identified motifs enriched within accessible chromatin regions near genes that were down-regulated in the fxr?/? cells relative to fxr+/+ cells in cluster 4. The position weight matrices (PWMs) of the enriched nucleotide sequences are shown. The TF family that most closely matches the motif is indicated above the PWM. |