|
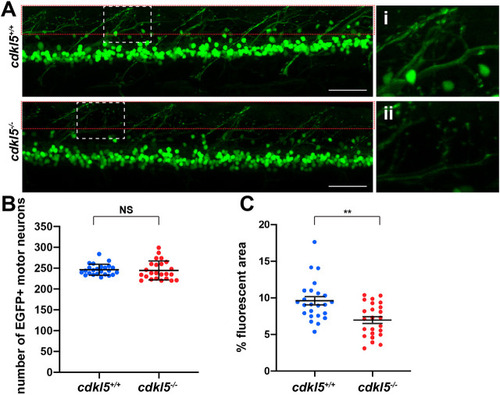
Assessment of neuronal pathology in cdkl5−/− fish. (A) Maximum intensity projection confocal images of EGFP-labelled motor neurons from Tg(islet1:EGFP); cdkl5+/+ (white dashed box zoomed in i) and Tg(islet1:EGFP); cdkl5−/− (white dashed box zoomed in ii) along the spinal region at 6 dpf. Red dashed boxes indicate the regions quantified in C. Scale bars: 50 µm. (B) Quantification of the number of EGFP+ motor neurons at 6 dpf. Data are mean±95% c.i. for three independent experiments [n=8, 8 and 8 for Tg(islet1:EGFP); cdkl5+/+, and n=8, 8 and 8 for Tg(islet1:EGFP); cdkl5−/− fish]. (C) Quantification of the mean percentage area of fluorescence from Tg(islet1:EGFP); cdkl5+/+ and Tg(islet1:EGFP); cdkl5−/− (within the red dashed box region in A) at 6 dpf. Data are mean±s.e.m. for three independent experiments [n=8, 8 and 8 for Tg(islet1:EGFP); cdkl5+/+, and n=8, 8 and 8 for Tg(islet1: EGFP); cdkl5−/− fish]. **P<0.01; NS, not significant (two-tailed t-test).
|