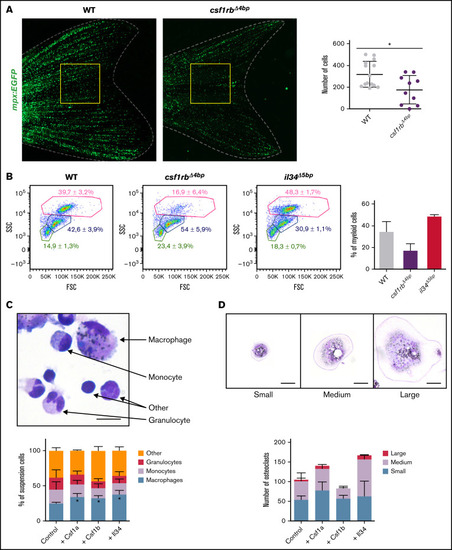
csf1rb is indispensable for definitive granulopoiesis. (A) Number of neutrophils in adult Tg(mpx:EGFP) = WT and Tg(mpx:EGFP);csf1rb?4bp = csf1rb?4bp fishtails. Neutrophils were manually counted in the area of the yellow square. WT n = 14, csf1rb?4bp n = 10. The level of statistical significance was determined by an unpaired 2-tailed t test. *P < .04. (B) FACS analysis of WKM cell suspension from WT, csf1rb?4bp, and il34?5bp adult zebrafish. WKMs pooled from 2 fish in 3 biological replicates, and 1 representative plot is shown for each condition. The numbers in FSC/SSC plots represent the mean percentage with SD in the gates of myeloid cells (pink gate), progenitors (blue gate), and lymphoid and small progenitor cells (green gate). The percentage of WKM cells in the myeloid gate is also shown in the bar graph on the right. (C-D) Ex vivo culture of WKM cells treated with Csf1a, Csf1b, or Il34 proteins. (C) After 3 days in culture, smears of suspension cells were stained on microscopic glass slides with May-Grünwald and Giemsa (MGG), and the number of differentiated cells (monocytes, macrophages, and granulocytes) was counted. The graph on the bottom shows the mean percentage of cells with SD. The level of statistical significance was determined by an unpaired 2-tailed t test. *P < .04. The scale bar on the microscopic image is 20 µm. Results from 3 biological replicates. (D) After 3 days in culture, adherent cells on the dish were washed with PBS, stained with MGG, and the number of small, medium, and large osteoclasts was counted in 20 fields of view with a magnification ×20 objective. The graph on the bottom shows the mean percentage of cells with SD. Results from 2 biological replicates. The scale bar on the microscopic image is 50 µm. Fluorescence images were acquired on Zeiss AxioZoom.V16 with Zeiss Axiocam 506 mono camera and ZEN Blue software. ImageJ and Adobe Photoshop were used for image processing. Bright-field images of ex vivo cultures were acquired on Leica DM 2000 microscope with Zeiss Axiocam 105 color camera.

