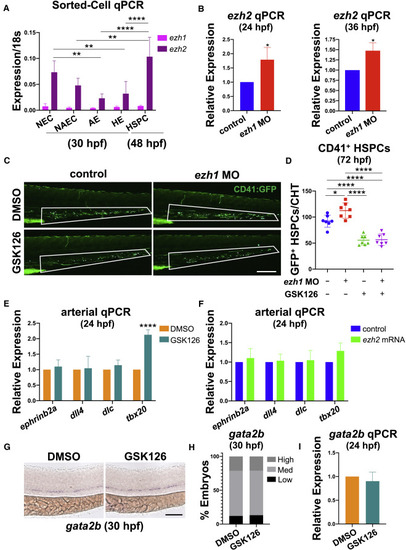
(A) Sorted cell qPCR at 30 and 48 hpf for ezh1 and ezh2 expression on bulk Flk1?/Flt1? non-endothelial cells (NEC), Flk1+/Flt1? non-arterial endothelial cells (NAEC), Flk1+/Flt1+ arterial endothelium (AE), Gata2b+ hemogenic endothelial cells (HE), and Flk1+/cMyb+ hematopoietic stem and progenitor cells (HSPC). Reference gene: 18s (n ? 20 embryos/sample � ?3 replicate clutches; two-way ANOVA, ??p < 0.01, ????p < 0.0001. Mean � SEM). (B) Whole-embryo ezh2 qPCR on control and ezh1 morphants at 24 and 36 hpf relative to 18s (n ? 25 embryos/sample � 3 replicate clutches; two-tailed unpaired Student's t test, ?p < 0.05. Mean � SEM). (C) In vivo imaging of CD41:GFP+ cells in the CHT in control and ezh1 morphants � dimethyl sulfoxide (DMSO)/1 ?M GSK126 treatment from 12 to 72 hpf. Scale bar, 200 ?m. (D) Quantification of fluorescent images in (C) (n = 7 embryos/condition; one-way ANOVA, ?p < 0.05, ????p < 0.0001. Error bars indicate SD). (E) Whole-embryo ephrinb2a, dll4, dlc, and tbx20 qPCR on DMSO and 1 ?M GSK126-treated embryos from 12 to 24 hpf relative to 18s (n ? 25 embryos/sample � ?3 replicate clutches; two-tailed unpaired Student's t test, ????p < 0.0001. Mean � SEM). (F) Whole-embryo ephrinb2a, dll4, dlc, and tbx20 qPCR on control and ezh2 mRNA-injected embryos at 24 hpf relative to 18s (n ? 25 embryos/sample � 3 replicate clutches; two-tailed unpaired Student's t test, not significant. Mean � SEM). (G) WISH for gata2b on DMSO and 1 ?M GSK126-treated embryos from 12 to 30 hpf. Scale bar, 100 ?m. (H) Qualitative phenotypic distribution plot of embryos in (G) (n = 33 DMSO, 38 GSK126-treated embryos). (I) Whole-embryo gata2b qPCR on DMSO and 1 ?M GSK126-treated embryos from 12 to 24 hpf relative to 18s (n ? 25 embryos/sample � 4 replicate clutches; two-tailed unpaired Student's t test, not significant. Mean � SEM).
|
