Fig. 6.
- ID
- ZDB-FIG-220304-15
- Publication
- Torregrosa-Carrión et al., 2021 - Adhesion G protein-coupled receptor Gpr126/Adgrg6 is essential for placental development
- Other Figures
- All Figure Page
- Back to All Figure Page
|
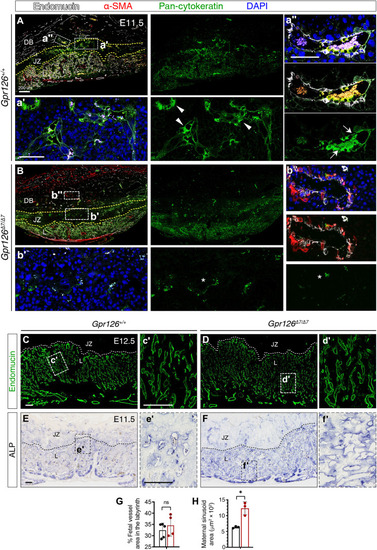
Gpr126?7/?7 mutant placentas show defective maternal spiral arteries remodeling and aberrant organization of maternal sinusoids in the labyrinth.
(A to B?) E11.5 Gpr126+/+ (A) and Gpr126?7/?7 (B) sagittal placental section immunostainings. Endomucin (white) labels maternal endothelial cells in the decidua basalis (DB) and fetal endothelial cells in the labyrinth (L); pan-cytokeratin (green) marks trophoblasts in DB, JZ, and L; ?-SMA (red) detects unremodeled spiral arteries in DB and maternal canals in L. Sections were DAPI counterstained (blue). The yellow dotted lines delineate the borders of JZ with DB and L. (A?, A?, B?, and B?) High magnifications corresponding to boxed areas. Arrowheads in (A?) indicate pan-cytokeratin?positive trophoblasts in JZ; arrows in (A?) mark trophoblasts surrounding maternal spiral arteries in the proximal DB; asterisks in (B? and B?) indicate reduced pan-cytokeratin expression. (C to D?) E12.5 Gpr126+/+ (C) and Gpr126?7/?7 (D) sagittal placental sections. Endomucin immunostaining (green) in fetal endothelial cells of L. The white dotted lines delineate the JZ and L border. Boxed regions (C and D) are magnified in (?). (E to F?) ALP staining on E11.5 Gpr126+/+ (E) and Gpr126?7/?7 (F) sagittal placental sections. Maternal blood sinusoids in L are detected by ALP activity of the syncytiotrophoblast layer. Black dotted lines delineate the JZ and L border. Boxed regions (E and F) are magnified in (?). (G) Quantification of fetal vessel area in relation to total placental L area in E12.5 Gpr126+/+ and Gpr126?7/?7 placentas. Data are means ± SD (n = 5 Gpr126+/+ and 4 Gpr126?7/?7 placentas). Statistical significance: Unpaired Student?s t test. (H) Quantification of maternal sinusoid area in L of E11.5 Gpr126+/+and Gpr126?7/?7 placentas: Sinusoids are larger in mutant placentas. Data are means ± SD (n = 3 Gpr126+/+ and 3 Gpr126?7/?7 placentas). Statistical significance: unpaired Student?s t test (*P < 0.05). Scale bars, 100 ?m; otherwise, it is indicated. |

