
Fig. 1.
- ID
- ZDB-FIG-220225-5
- Publication
- Diamond et al., 2022 - Computational anatomy and geometric shape analysis enables analysis of complex craniofacial phenotypes in zebrafish
- Other Figures
- All Figure Page
- Back to All Figure Page
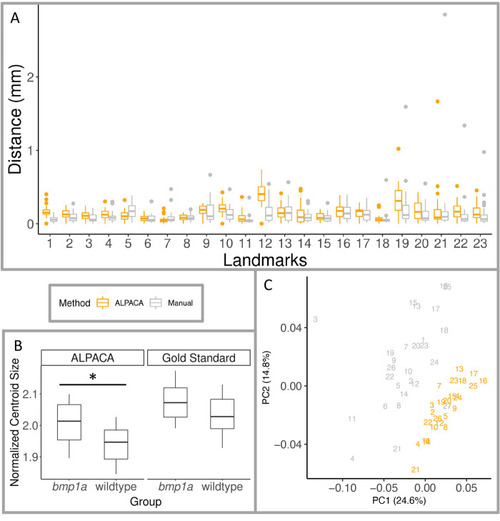
Pipeline validation using 23 traditional landmarks. Boxplots are shown for (A) Euclidean distance between Gold Standard landmark locations and ALPACA transferred points (orange), and distance between the two manual landmark placements (grey), where color indicates method used for all panels, and (B) normalized centroid size of gold standard and ALPACA transferred pseudo-landmarks. Midline of boxplots show median value, with hinges corresponding to first and third quartiles, and whiskers extending to largest and smallest value no further than 1.5 times the interquartile range. Also shown (C) are the first two principal components of shape space from the combined GPA analysis of gold standard and ALPACA transferred 23 landmarks. The percent of variance for each PC is show in parenthesis of each axis. Individual fish are depicted as different numbers, fish 1?12 are crispant fish, fish 13?26 are wild-type fish, and fish 27 is the atlas. |