Fig. 3
- ID
- ZDB-FIG-220131-22
- Publication
- Restuadi et al., 2022 - Functional characterisation of the amyotrophic lateral sclerosis risk locus GPX3/TNIP1
- Other Figures
- All Figure Page
- Back to All Figure Page
|
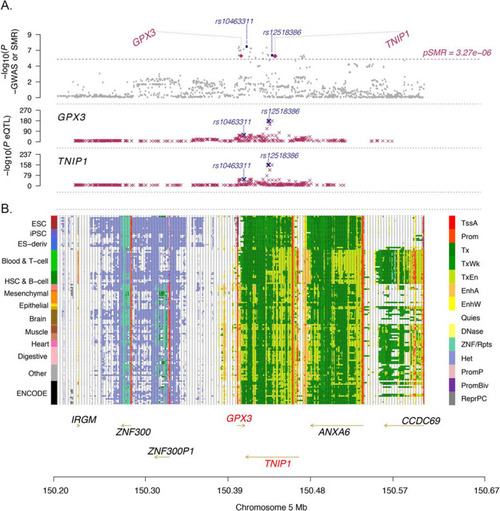
Summary statistics-based Mendelian Randomisation (SMR) analysis identifies GPX3 and TNIP1. Regional map association plot of GPX3 and TNIP1 from summary statistics-based SMR analysis. The x-axis, chromosome position, is the same in all plots. A Grey dots represent the GWAS p-values, with the purple diamonds representing the SMR test p-values for the two genes (GPX3 and TNIP1) probes that pass the SMR genome-wide significance threshold (dashed line). The purple crosses are the association p-values between the SNP and gene probe. The SNP most highly associated with both GPX3 and TNIP1 expression is rs12518386 (GWAS association pGWAS = 8.33 × 10?7, Beffect GWAS = 0.08, peQTL:GPX3 = 1.05 × 10?171, peQTL:TNIP1 = 2.04 × 10?163). The SNP most associated with ALS is rs10463311 (pGWAS = 4.00 × 10?8, Beffect GWAS = 0.09, peQTL:GPX3 = 4.85 × 10?18, peQTL:TNIP1 = 1.80 × 10?36) (Additional file 1: Table S12). B The locus is in a region of open chromatin (each row is a cell type, 13 tissue/cell categories in total on the left) including transcriptional areas and enhancers (coloured legend on the right) between GPX3 (transcribed on the forward strand) and TNIP1 (transcribed on the reverse strand) |

