
Figure 7
- ID
- ZDB-FIG-220131-195
- Publication
- Klaver et al., 2021 - Protease-dependent defects in N-cadherin processing drive PMM2-CDG pathogenesis
- Other Figures
- All Figure Page
- Back to All Figure Page
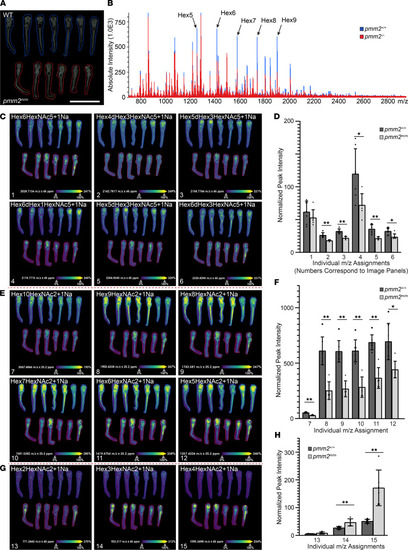
MALDI MS imaging reveals specific defects in N-glycosylation.
(A) Representative image of embryo sections analyzed by MALDI MS imaging. Individual areas imaged are outlined in red (pmm2m/m; n = 5) or blue (pmm2+/+; n = 7). Scale bar: 2 mm. (B) Overall average spectral comparison of pmm2+/+ and pmm2m/m demonstrates changes in N-glycosylation. Select contrasting high-mannose [Hex(n)] peaks are highlighted with arrows. (C and D) Representative images of complex-type N-glycans. Numbers on image panels correspond to bars on graph. Graph quantifying differences in complex glycans between pmm2+/+ and pmm2m/m embryos. Each dot represents quantification of peak intensity from a single embryo. Data represent mass to charge ratio (m/z) indicative of glycan identity. Error bar shows standard deviation, Mann-Whitney U test, P < 0.01 considered significant, *P < 0.01, **P < 0.001. (E and F) Representative images of high-mannose N-linked oligosaccharides. Numbers on image panels correspond to bars on graph. Graph quantifying differences in high-mannose N-linked oligosaccharides between pmm2+/+ and pmm2m/m embryos. Each dot represents quantification of peak intensity from a single embryo. Data represent m/z indicative of glycan identity. Error bar shows standard deviation, Mann-Whitney U test, *P < 0.01, **P < 0.001. (G and H) Representative images of truncated N-glycans. Graph quantifying differences in truncated sugars between pmm2+/+ and pmm2m/m embryos. Each dot represents quantification of peak intensity from a single embryo. Error bar shows standard deviation, Mann-Whitney U test, P < 0.01 considered significant, **P < 0.001. |
| Fish: | |
|---|---|
| Observed In: | |
| Stage: | Day 6 |