
FIGURE
Fig. 1.1
- ID
- ZDB-FIG-211214-3
- Publication
- Gillotay et al., 2020 - Single-cell transcriptome analysis reveals thyrocyte diversity in the zebrafish thyroid gland
- Other Figures
- All Figure Page
- Back to All Figure Page
Fig. 1.1
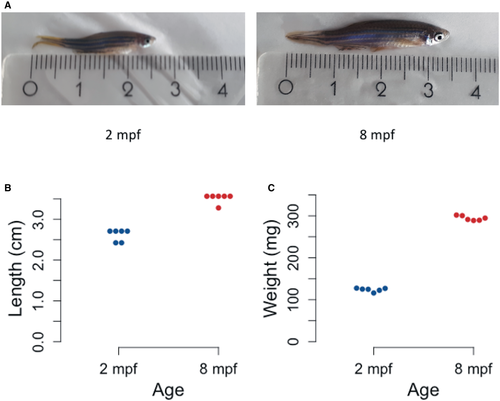
A. Representative images of zebrafish at 2 mpf (left) and 8 mpf (right). The ruler depicts length in cm. B. Dotplot representing the length of individual animals at each stage. Y-axis represents the length of six zebrafish from mouth to end of fin in cm. C. Dotplot representing the weight of individual animals at each stage. Y-axis represents the weight of six zebrafish in mg. |
Expression Data
Expression Detail
Antibody Labeling
Phenotype Data
Phenotype Detail
Acknowledgments
This image is the copyrighted work of the attributed author or publisher, and
ZFIN has permission only to display this image to its users.
Additional permissions should be obtained from the applicable author or publisher of the image.
Full text @ EMBO Rep.