|
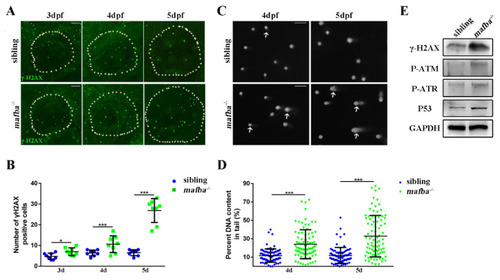
Analysis of the accumulation of DNA damage in mafba?/? mutants? inner-ear. (A) Whole-mount immunofluorescence analysis using the anti-?H2AX antibody in siblings and mafba?/? inner-ear at 3, 4, and 5 dpf. The white, dotted circle represents the inner ear area. Scale bars: 20 �m. (B) Statistical analysis of the ?H2AX-positive cells is shown in (A). (C) The alkaline comet assay showed increased DNA damage in mafba?/? embryos at 4 and 5 dpf. White arrows show DNA-damaged cells with single- or double-strand breaks. Scale bars: 10 �m. (D) Quantitative analysis of 88 cells from 10 embryos in siblings and mafba?/? group are shown. (E) Western blot analysis of ?H2AX, P-ATM, P-ATR, and p53 in siblings and mafba?/? zebrafish at 4 dpf. GAPDH was used as the normalized protein control. Data are represented as mean � SD; *, p < 0.05; ***, p < 0.001.
|