|
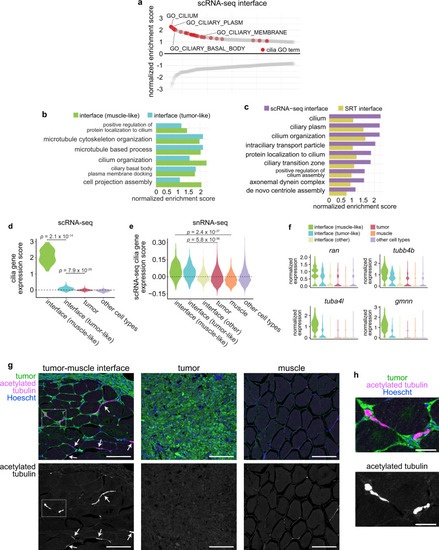
Cilia genes and proteins are enriched at the tumor–microenvironment interface.a Waterfall plot showing the top and bottom 250 GO cellular component terms by normalized enrichment score (NES) in the scRNA-seq interface cluster, with cilia GO terms labeled in red. b Cilia-related GO term enrichment scores within the tumor-like and muscle-like interface cell states from the scRNA-seq dataset. c Cilia-related GO term enrichment scores for the scRNA-seq and SRT interface clusters. d Relative expression of fish SYSCILIA genes in the scRNA-seq interface cluster. e Relative expression of the top 25 SYSCILIA genes upregulated in the scRNA-seq interface cluster across the snRNA-seq clusters. d, ep-values are noted (Wilcoxon rank sum test, two-sided, with Bonferroni’s correction). f Normalized expression of selected cilia genes across the snRNA-seq interface clusters. g Immunofluorescent images of sections through adult zebrafish with invasive melanomas, stained for GFP (tumor cells), acetylated tubulin (cilia), and Hoescht (nuclei), showing the tumor-muscle interface (left), center of the tumor (middle), and distant muscle (right). Arrows denote cilia at the interface. Scale bars, 100 µm. Images are representative from at least three independent experiments. h Inset of region highlighted in g (left). Scale bars, 25 µm.
|