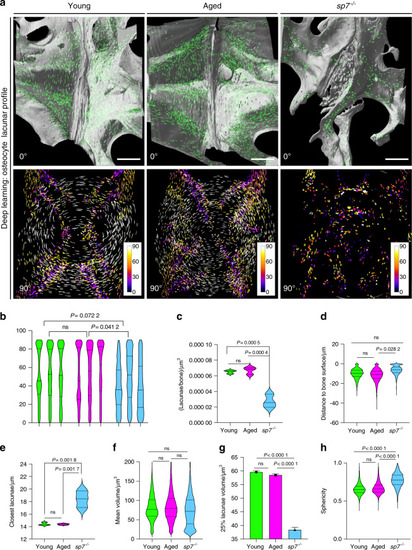
The osteocyte lacunar profile is unchanged in aged fishbut is dramatically compromised in young sp7−/− fish. a The top panel presents 3D volumetric rendering and postimaging analysis of young (1 y wt), aged (3 y wt), and sp7−/− (1 y) (lateral view of the IVD, 0°), showing vertebral bone and segmented lacunae (labeled in green), resulting from automated image segmentation using deep learning. Note the distribution of lacunae at the endplates and along the bone, with a dramatic reduction in sp7−/−. The bottom panel shows segmented lacunae (90° clockwise rotation from the lateral view of the IVD), color coded to show orientation (angle), with the center of the vertebral centrum as reference for orientation. Scale bars = 50 μm. b Violin plot of lacunae orientation from the center of the centrum. Data are individual zebrafish (n = 3). Nested one-way ANOVA, post hoc Tukey’s multiple comparisons test. P values are indicated. ns nonsignificant. c Violin plot of number of lacunae per volume of bone. One-way ANOVA, post hoc Tukey’s multiple comparisons test. P values are indicated. ns nonsignificant. d Violin plot of lacunae distances from the bone surface. Nested one-way ANOVA, post hoc Tukey’s multiple comparisons test. P values are indicated. ns nonsignificant. e Violin plot of the distance to the closest lacunae. Data are the mean (n = 3). Nested one-way ANOVA, post hoc Tukey’s multiple comparisons test. P values are indicated. ns nonsignificant. f Violin plot of lacunae volume. Note the subpopulation of lacunae showing a small volume in sp7−/− zebrafish. Data are the mean (n = 3). Nested one-way ANOVA, post hoc Tukey’s multiple comparisons test. P values are indicated. ns nonsignificant. g The top 25% smallest lacunae volume from young (1 y), aged (3 y), and sp7−/− (1 y) zebrafish were compared. One-way ANOVA, post hoc Tukey’s multiple comparisons test. P values are indicated. ns nonsignificant. h Violin plot of lacunae sphericity (circularity). Data are the mean (n = 3). Nested one-way ANOVA, post hoc Tukey’s multiple comparisons test. P values are indicated. ns nonsignificant
|
