
Figure 1:
- ID
- ZDB-FIG-210917-1
- Publication
- Yu et al., 2021 - Lysosomal cholesterol accumulation contributes to the movement phenotypes associated with NUS1 haploinsufficiency
- Other Figures
- All Figure Page
- Back to All Figure Page
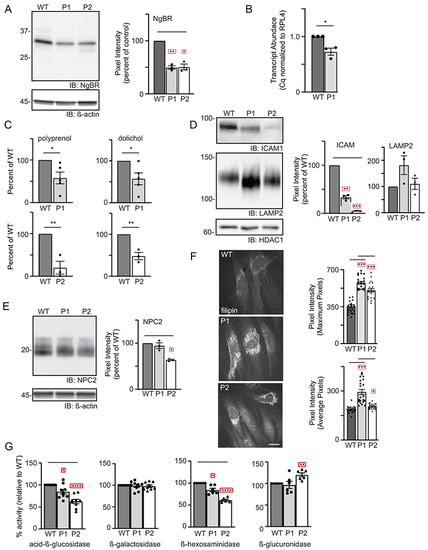
(A) Representative Western blot for NgBR in WT and patient fibroblasts and quantitation of NgBR levels relative to ß-actin (n=3). Error=S.E.M. Statistical analysis was performed using a Dunnett’s test. (B) Quantitative PCR analysis of NUS1 transcripts in WT and P1 fibroblasts (n=3). The number of WT vs. variant alleles is shown. (C) Analysis of total dolichol and polyprenol levels in WT and patient fibroblasts. Analysis of the two patient lines (P1; n=5 and P2; n=3) were performed at different times using separate WT cells. Statistical analysis was performed using an unpaired Student’s t test. (D) Representative Western blots for ICAM1 and LAMP2 in WT and patient fibroblasts and quantitation of protein levels relative to HDAC1 (n=3). Error=S.E.M. Statistical analysis was performed using a Dunnett’s test. (E) Representative Western blot for NPC2 in WT and patient fibroblasts and quantitation of levels relative to ß-actin (n=3). Error=S.E.M. Statistical analysis was performed using a Dunnett’s test. (F) Representative images of filipin-stained WT and patient fibroblasts and quantitation of pixel intensity in at least 40 different regions across 20 different cells. Error=S.E.M. Statistical analysis was performed using a Dunnett’s test. Scale bar = 10μm. (G) Protein-normalized activity of acid-ß-glucosidase, ß-hexosaminidase, ß-glucuronidase and ß-galactosidase in WT and patient fibroblasts. Arbitrary fluorescence units are plotted. Statistical analysis was performed using a Dunnett’s test. For all statistics *p<0.05, ** p<0.01, ***p<0.001. Red boxes indicate the additional correction (Dunnett’s test) was applied for comparison to a single control group. |