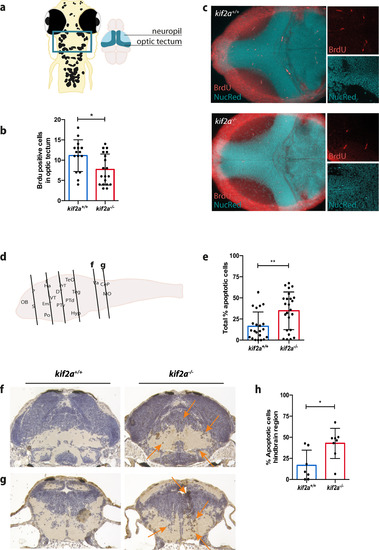
Neuronal cell proliferation defects and increased apoptosis in kif2a−/− larvae. a, Cell proliferation was measured in the optic tectum of 5 dpf kif2a+/+ and kif2a−/− larvae as indicated in the diagram. b, Comparison of the number of proliferating cells in the optic tectum of kif2a+/+ and kif2a−/− larvae showing BrdU-positive cells in dorsal z-stacks. Data are represented as the mean ± SD. Significant values are noted as *p ≤ 0.1. c, Representative z-stacks of optic tecta with BrdU and nuclei staining of kif2a+/+ and kif2a−/− larvae at 5 dpf. d, Histologic assessment of 5 dpf kif2a−/− and kif2a+/+ larval brains. Six brain regions (from forebrain to hindbrain) were selected per genotype as indicated in the diagram. e, Total amount of apoptotic cells in the brain of kif2a+/+ and kif2a−/− larvae. Data are represented as the mean ± SD. Significant values are noted as **p ≤ 0.01. f, g, Coronal sections stained against active caspase-3, imaged at 20× magnification. h, Percentage of apoptotic cells in the hindbrain region of kif2a+/+ and kif2a−/− larvae. Data are represented as the mean ± SD. Significant values are noted as *p ≤ 0.05.
|
