
Figure 6.
- ID
- ZDB-FIG-210904-27
- Publication
- Yan et al., 2021 - Single-cell imaging of T cell immunotherapy responses in vivo
- Other Figures
- All Figure Page
- Back to All Figure Page
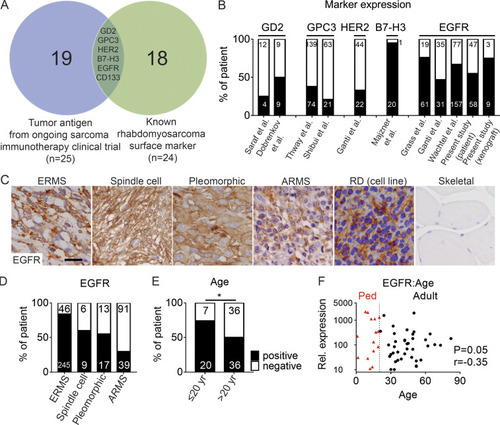
EGFR is expressed in a large fraction of human RMS patients. (A) Venn diagram showing overlap of RMS surface antigens that are currently being investigated in clinical trials for sarcomas. (B) Percentage of RMS patients expressing cell surface epitopes by IHC analysis. (C) IHC immunostaining of EGFR antibody on primary human RMS (four left panels), RD xenografts grown in NSG mice, and normal pediatric skeletal muscle. (D) Percentage of RMS patient samples expressing EGFR based on IHC staining across different subtypes of the disease. (E) Percentage of pediatric and adult RMS patients that express EGFR. *, P < 0.05, ?2 test. (F) Higher EGFR expression correlates with young age (P = 0.05, r = ?0.35, linear regression analysis). Pediatric patients of <25 yr of age are shown by red triangles. Scale bar equals 10 �m (C). Ped, pediatric; Rel., relative. |