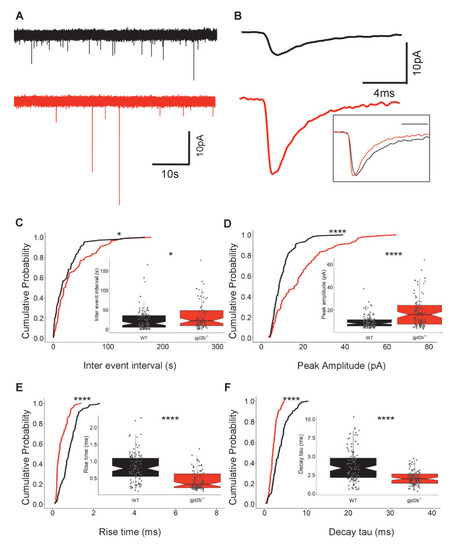
(A) Representative miniature excitatory postsynaptic current (mEPSC) recordings from Purkinje neurons (PNs) of wild-type (black trace) and gjd2b-/- (red) larvae. (B) Average mEPSC shown on expanded time base recorded from wild-type (black) and gjd2b-/- (red) larvae. Neurons were held at ?65 mV. Inset: scaled mEPSC to show faster rise time and decay time of mEPSCs in mutants. (C?F) Cumulative probability histograms and boxplots reveal increased inter-event intervals (C), increased peak amplitudes (D), decreased 10?90% rise times (E), and decreased decay time constants (F) of mEPSCs in gjd2b-/- larvae (red lines) compared to wild type (black lines). N = 8 cells in wild type and 10 cells in gjd2b-/- larvae. *p<0.05; ****p<0.0001; Mann?Whitney U test. Data used for quantitative analyses are available in Figure 3?source data 1. See also Figure 3?figure supplement 1.