
Fig. 3
- ID
- ZDB-FIG-210715-4
- Publication
- Chambers et al., 2020 - Ppargc1a Controls Ciliated Cell Development by Regulating Prostaglandin Biosynthesis
- Other Figures
- All Figure Page
- Back to All Figure Page
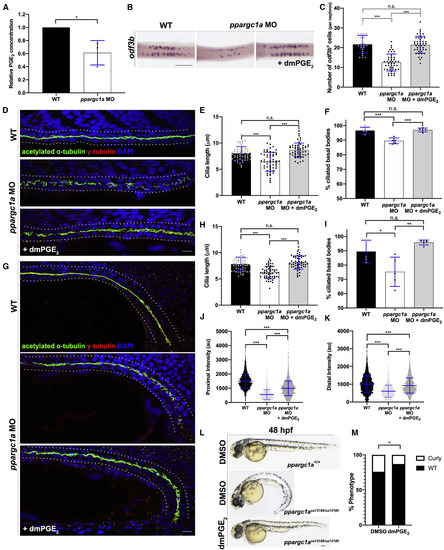
ppargc1a Loss of Function Phenotypes Can Be Rescued by Supplementing with PGE2 (A) Relative concentration of PGE2 in WT and ppargc1a morphants. (B) MCCs stained via WISH for odf3b at 24 hpf in WT (left), ppargc1a MO (middle), and ppargc1a morphants treated with dmPGE2 (right). Scale bar, 90 ?m. (C) Graph depicting the number of MCCs present in WT, ppargc1a MO, and ppargc1a MO treated with dmPGE2. (D) Twenty-eight hours post-fertilization WT (top), ppargc1a MO-injected (middle), and ppargc1a MO-injected + dmPGE2 (bottom) zebrafish stained via whole-mount immunofluorescence for acetylated ?-tubulin (cilia, green), ?-tubulin (basal bodies, red), and DAPI in the proximal pronephros. Scale bar, 10 ?m. (E) Cilia length in micrometers for the proximal pronephros of WT, ppargc1a morphants, and ppargc1a morphants treated with dmPGE2. (F) Graph of the percentage of ciliated basal bodies/total basal bodies per 100 ?m in the proximal pronephros. (G) Twenty-eight hours post-fertilization WT (top), ppargc1a MO-injected (middle), and ppargc1a MO-injected + dmPGE2 (bottom) zebrafish stained via whole-mount immunofluorescence for acetylated ?-tubulin (cilia, green), ?-tubulin (basal bodies, red), and DAPI in the distal pronephros. Scale bar, 10 ?m. (H) Cilia length in micrometers for the distal pronephros of WT, ppargc1a morphants, and ppargc1a morphants treated with dmPGE2. (I) Graph of the percentage of ciliated basal bodies/total basal bodies per 100 ?m in the distal pronephros. (J and K) Scatterplots illustrating the difference in fluorescent intensity signals of WT, ppargc1a MO, and ppargc1a MO + dmPGE2 in proximal (J) and distal (K) cilia. (L) Representative images of ppargc1a+/sa13186 in crosses shown at 48 hpf WT zebrafish treated with DMSO (top), curly ppargc1asa13186/sa13186 treated with DMSO (middle), and a WT-appearing, genotype-confirmed ppargc1asa13186/sa13186 rescued with dmPGE2 (bottom). Scale bar, 90 ?m. (M) The percentage of zebrafish with WT (black) or curly (white) phenotypes at 48 hpf after treatment with DMSO or dmPGE2. Chi-square test indicates significance. Data are represented as mean � SD. ?p < 0.05, ??p < 0.01, and ???p < 0.001 (one-way ANOVA or t test); n.s., not significant. |
| Gene: | |
|---|---|
| Antibodies: | |
| Fish: | |
| Condition: | |
| Knockdown Reagent: | |
| Anatomical Terms: | |
| Stage: | Prim-5 |
| Fish: | |
|---|---|
| Condition: | |
| Knockdown Reagent: | |
| Observed In: | |
| Stage Range: | Prim-5 to Long-pec |