|
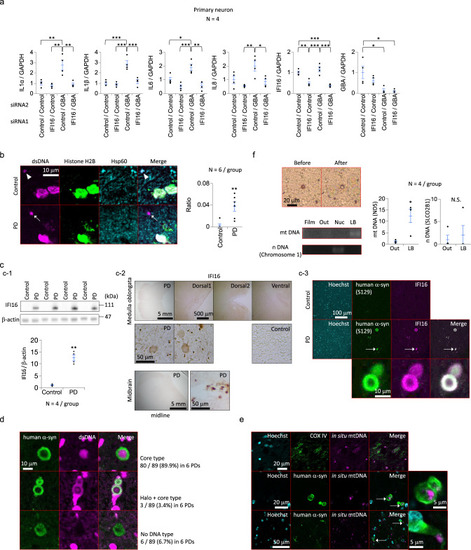
Accumulation of cytosolic dsDNA of mitochondrial origin in the brains of humans with Parkinson’s disease.a Effect of IFI16 depletion (siRNA knockdown) on type I IFN responses in human primary neurons following GBA knockdown. qPCR results for IL-1α, IL-1β, IL-6, IL-8, IFI16, and GBA mRNAs are shown. b Cytosolic dsDNA deposits in the brains of humans with PD (medulla oblongata). A white arrow indicates cytosolic dsDNA of mitochondrial origin. A white arrowhead indicates mtDNA within mitochondria. The graph shows the ratio of ectopic dsDNA+ number/Hoechst 33258+ cell number in the brain specimens. PD: Parkinson’s disease. c (c-1) Western blot of the IFI16 protein in brains (amygdala) of humans with PD. PD: Parkinson’s disease. c-2 Immunohistochemistry of the IFI16 protein in brains (medulla oblongata and midbrain) of humans with PD. Note that PD pathology is often observed in the amygdala and dorsal nucleus of the vagus nerve in the medulla oblongata43,44. PD: Parkinson’s disease. c-3 Immunofluorescence of the IFI16 protein in brains (medulla oblongata) of humans with PD. The white arrow indicates a Lewy body containing α-synuclein and IFI16. PD: Parkinson’s disease. α-syn: α-synuclein. d Immunofluorescence staining of human brain tissues using an anti-dsDNA antibody and anti-α-synuclein antibody. α-syn: α-synuclein. e In situ hybridization of human brain tissues (medulla oblongata) using mitochondrial DNA probes. White arrows indicate Lewy bodies or Lewy neurites containing mitochondrial DNA. α-syn: α-synuclein. f Laser microdissection of brain sections (medulla oblongata) and subsequent PCR amplification of mitochondrial or nuclear DNA sequences. The graph shows the relative amount (qPCR) of mitochondrial or nuclear DNA. “Before” shows DAB staining performed just before laser microdissection, and “After” shows staining after microdissection. Film: samples dissected from only the cover film, Out: samples dissected from areas without Lewy bodies in the brain specimens, Nuc: samples dissected from the nuclei in the brain specimens (HE staining), LB: samples dissected from the cores of Lewy bodies in the brain specimens. mtDNA: Mitochondrial DNA. n NDA: Nuclear DNA. N.S.: statistically not significant. The statistical details are described in Supplementary Table 4. Source data of Fig. 5 are provided as a Source Data file.
|

