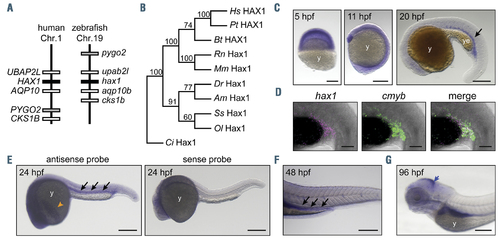
Characterization of zebrafish hax1. (A) Schematic comparison showing syntenic conservation of the hax1 loci in humans and zebrafish. (B) A neighbor-joining phylogenetic tree of Hax1 proteins, which was performed with 1,000 bootstrap replications. Am, Astyanax mexicanus; Bt, Bos taurus; Ci, Ciona intestinalis; Dr, Danio rerio; Hs, Homo sapiens; Mm, Mus musculus; Ol, Oryzias latipes; Pt, Pan troglodytes; Rn, Rattus norvegicus; Ss, Salmo salar. (C) Spatial hax1 expression by whole mount in situ hybridization analysis from 5 to 20 hours post-fertilization (hpf). (D) Confocal image of double fluorescent in situ hybridization of hax1 (magenta) and cmyb (green) at 20 hpf. (E-G) Spatial hax1 expression at 24 (E), 48 (F) and 96 (G) hpf. Arrows in C, E, and F indicate hax1 expression in the hematopoietic site. A sense probe was used as a negative control (E, right panel). Note that the images shown in E are two images stitched together. y: yolk; ye: yolk extension. Scale bars: 100 mm (C, E-G), 50 mm (D).
|
