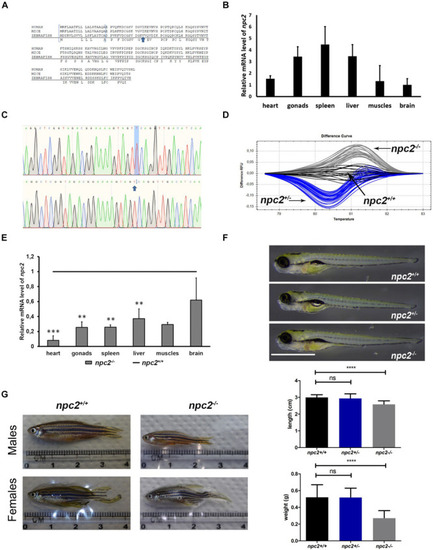
Zebrafish npc2 mutant. (A) Multiple species alignments demonstrated high conservation of the NPC2 protein among vertebrates. Arrows indicate positions of the mutation. (B) Expression levels of the npc2 gene in different tissues in adult fish. Expression was normalized to tissue with the lowest expression (brain). (C) Chromatograms confirmed a small deletion in the npc2 mutant. (D) Graphical representation of melt profiles in wildtypes (black), heterozygous mutants (blue), and homozygous mutants (gray) that originated from fish after incrossing npc2±. (E) mRNA levels of the npc2 gene in various organs in npc2–/– zebrafish relative to wildtype controls. The data are expressed as the mean ± SEM of three 9-month-old fish per group. Error bars represent the SEM. ***p < 0.001 and **p < 0.01. (F) Wildtype, heterozygous, and homozygous npc2 mutants had indistinguishable phenotypes at 5 dpf. Scale = 1 mm. (G) Morphology of adult fish. Smaller body size and weight in 8-month-old npc2–/– fish and indistinguishable phenotype of npc2±. Error bars represent the SD.
|
