|
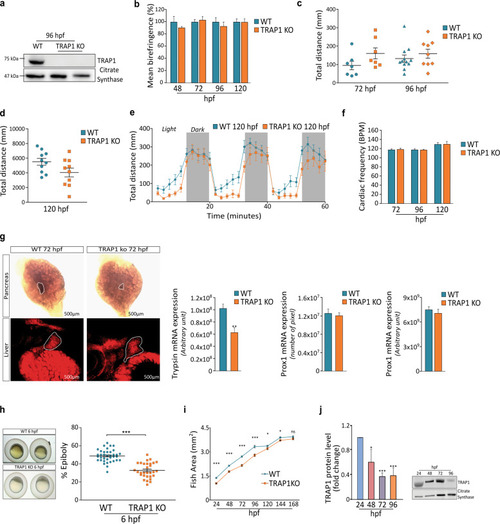
Characterization of Zebrafish TRAP1 Knock-out fish.a Western blot analysis of TRAP1 protein level in wild-type and knock-out animals at 96 hpf. The mitochondrial protein citrate synthase was used as a loading control. b Quantification of Zebrafish embryos birefringence from 48 hpf to 120 hpf; data are presented as percentage of muscle birefringence normalized for the fish area for at least 10 animals per condition for three independent experiments. c–d Behavioral assay showing the total distance moved by fish embryos for at least 12 animals per condition. e Average distance (in mm) for each 2-min interval swum by larvae under light-dark period (dark period in gray) at 5 dpf. f Cardiac frequency measured in at least 10 animals per condition expressed as beats per minute (BPM) that were calculated by averaging the beats counted four times in 15 s. g In situ analysis of liver prox1 and pancreas trypsin markers in zebrafish embryos at 72 hpf, data are reported as average ±SEM. with an unpaired two-tailed Student’s t test of four animals per condition. h Representative images of developing embryos at 6 hpf and measurements of epiboly area; the yolk was not considered in the analysis. i Kinetics of fish growth during the first 7 days of development. The total fish area, excluding the yolk region, was evaluated. j Analysis of TRAP1 protein expression profile during the first four days of embryogenesis. Asterisks indicate significant differences (*p < 0.05, **p < 0.01, ***p < 0.001).
|