
Fig. 8
- ID
- ZDB-FIG-210422-50
- Publication
- Xie et al., 2021 - Altered Visual Function in a Larval Zebrafish Knockout of Neurodevelopmental Risk Gene pdzk1
- Other Figures
- All Figure Page
- Back to All Figure Page
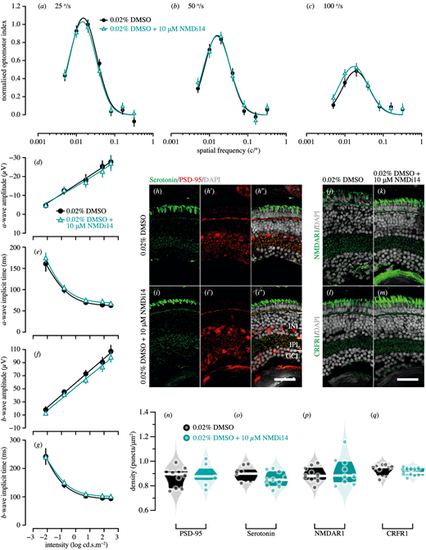
Genetic compensation tests for pdzk1-KO mutants at 7 dpf. Spatial frequency tuning functions were fitted by a log-Gaussian model for control (pdzk1-KO mutants treated with 0.02% DMSO; black circles and lines) and experimental groups (pdzk1-KO mutants treated with 0.02% DMSO and 10-�M NMDi14; blue triangles and lines) at (a) 25�/s, (b) 50�/s, and (c) 100�/s. ERG results were shown as the group average (�SEM) of (d) a-wave amplitude, (e) a-wave implicit time, (f) b-wave amplitude, and (g) b-wave implicit time for pdzk1-KO mutants treated with 0.02% DMSO (filled black circles) and mutants treated with 0.02% DMSO and 10-�M NMDi14 (open cyan triangles). Data were compared using two-way ANOVA; there were no significant differences. Lines were fit by a four-parameter sigmoidal function. For histological assessment, (h?i?) serotonin and PSD-95 were co-labeled in green and red, respectively, for both groups; (j, k) NMDAR1and (l, m) CRFR1 were labeled in green. For all images, nuclei were stained with DAPI, shown in gray. Scale bars: 25 �m. Violin plots show densities in the IPL of (n) PSD-95, (o) serotonin, (p) NMDAR1, and (q) CRFR1 for mutants treated with 0.02% DMSO (black circles) and mutants treated with 0.02% DMSO and 10-�M NMDi14 (cyan circles). Points represent data from individual retinas. White lines represent medians, and dark bands indicate interquartile ranges. Unpaired t-tests were performed with 10 or 11 retinas per group (see Supplementary Table S6). |