|
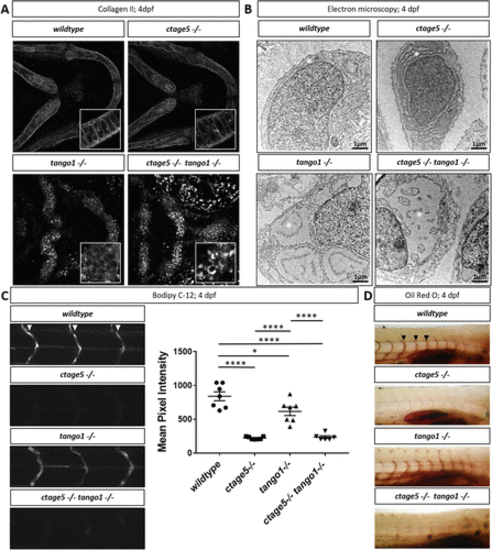
Trafficking differences in ctage5 vs. tango1 mutant embryos. (A) Representative 40� images showing collagen 2 wholemount immunohistochemistry in 4dpf larvae chondrocytes (n = 3?4 per group). Inserts are 40� images with 3� zoom and cropped to show higher-resolution chondrocyte collagen 2 staining. (B) Representative electron microscopy images of endoplasmic reticulum (*) in 4dpf larvae chondrocytes (n = 3 per group). (C) Representative images and quantification of BODIPY C-12 fluorescence in the intersegmental vessels (arrowheads; one-way ANOVA, F = 39.36, p < 0.0001). (D) Representative images of Oil Red O staining for lipids in 4dpf zebrafish larvae intersegmental vessels (arrowheads). * = p < 0.05, **** = p < 0.0001.
|