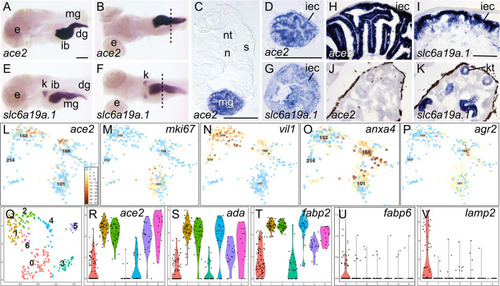
Identifying the ace2-expressing cell type. (A-K) In situ hybridization for ace2 and slc6a19a.1. (A-G) 5 dpf larvae, (A) lateral view and (B) ventral view of ace2 expression. (C) Cross-section of larva stained for ace2 expression at level of the dotted line in B. (D) Close-up of the middle gut cross-section showing intestinal epithelial cells expressing ace2. (E) Lateral view and (F) ventral view of slc6a19a.1 expression. (G) Cross-section at level of the dotted line in F. (H-K) Adults. H, ace2 expression in middle gut, with (J) no expression in kidney. (I,K) slc6a19a.1 expression in middle gut and kidney, respectively. (L-P) Feature plots of intestinal epithelial cells expressing ace2 and marker genes for intestinal stem cells (mki16), enterocytes (villin, vil1), enteroendocrine cells (anxa4), and goblet cells (agr2). (Q) Umap plot for subclustering of cells in original c152, c168, and c214. (R) Violin plot for ace2 in the subclusters. (S-V) Violin plots for genes representing regions along the mouse intestine, including (S) duodenum (ada); (T) jejunum (fabp2); (U) ileum (fabp6); and (V) colon (lamp2). dg, distal gut; e, eye; ib, intestinal bulb; iec, intestinal epithelial cell; k, kidney; kt, kidney tubule; mg, middle gut; n, notochord; nt, neural tube; s, somite. Scale bar in A for A, B, E, F, 100 μm; in C, 50 μm; in D for D and G, 50 μm; in I for H-K, 100 µm.
|

