
Fig. 2
- ID
- ZDB-FIG-210316-16
- Publication
- Chambers et al., 2020 - Kctd15 regulates nephron segment development by repressing Tfap2a activity
- Other Figures
- All Figure Page
- Back to All Figure Page
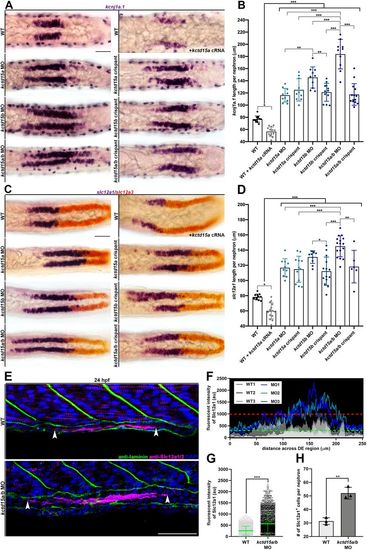
kctd15a/b loss-of-function initiates expansion of DE lineage markers. (A) Whole-mount in situ hybridization of kcnj1a.1 (purple) at 24 hpf in the pronephros of wild type, wild type+kctd15a cRNA, three kctd15 MOs and three kctd15 crispants. Scale bar: 35 μm. (B) Absolute length quantification of the kcnj1a.1 expression domain. Black brackets cluster groups together for collective comparison. (C) Whole-mount in situ hybridization of slc12a1 (purple) and slc12a3 (red) at 24 hpf in the pronephros of wild type, wild type+kctd15a cRNA, three kctd15 MOs and three kctd15 crispants. Scale bar: 35 μm. (D) Absolute length quantification of slc12a1 expression domain. Black brackets cluster groups together for collective comparison. (E) Immunofluorescence of Slc12a1/2 (magenta) and laminin (green) in wild type and kctd15a/b MO at 24 hpf in pronephric cells. White arrowheads mark the limits of Slc12a1/2 pronephric expression. Scale bar: 35 μm. (F) Fluorescent intensity plot of three wild-type (grayscale) and three kctd15a/b MO (blue) individuals. Green dashed line equates to wild-type Slc12a1/2 intensity threshold (au). Red dashed line represents wild-type maximum Slc12a1/2 intensity value (au). (G) Scatterplot of Slc12a1/2 fluorescence intensity values. (H) Quantification of number of Slc12a1+ pronephric cells per nephron. n≥3 embryos quantified for each control and experimental group. *P<0.05; **P<0.01; ***P<0.001. Data are mean±s.d. Absolute lengths were compared using ANOVA. Fluorescent intensities and cell counts were analyzed using unpaired t-tests. |