Fig. 2
- ID
- ZDB-FIG-210217-39
- Publication
- Aguillon et al., 2020 - Morphogenesis is transcriptionally coupled to neurogenesis during peripheral olfactory organ development
- Other Figures
- All Figure Page
- Back to All Figure Page
|
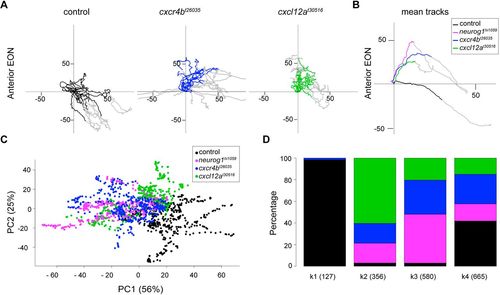
Morphogenetic defects in cxcr4bt26035 and cxcl12at30516 mutant embryos resemble those of neurog1hi1059. (A) Tracks showing migration of anterior EON from control (black), cxcr4bt26035 (blue) and cxcl12at30516 (green) embryos. Twelve anterior tracks are represented (two cells each from the left and right of three embryos). The origin of the tracks has been arbitrarily set to the intersection of the x/y-axes and the early (coloured) and late (grey) phases of migration have been highlighted. (B) Mean tracks showing migration of anterior EON of control (black), neurog1hi1059 (magenta), cxcr4bt26035 (blue) and cxcl12at30516 (green) mutant embryos. (C) Pairwise PCA scatterplots of morphogenetic parameters extracted from the datasets corresponding to the tracks in B. The major difference between control, neurog1hi1059, cxcr4bt26035 and cxcl12at30516 mutant embryos (PC1) corresponds to the antero-posterior axis. (D) Clustering analysis of morphogenetic parameters extracted from the datasets presented in B and analysed in C. One cluster, k1, contains almost exclusively control cells (black), whereas cells from neurog1hi1059 (magenta), cxcr4bt26035 (blue) and cxcl12at30516 (green) mutant embryos clustered together in k2, k3 and k4. |

