|
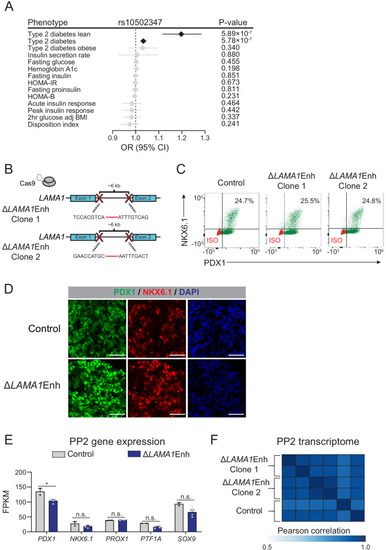
Deletion of the <italic>LAMA1</italic>-associated pancreatic progenitor-specific enhancer does not affect pancreatic lineage specification.(A) Odds ratio estimates (points) and 95% CIs (lines) for rs10502347 association with T2D and metabolic GWAS traits. Significant associations are colored black, non-significant are colored light grey. (B) Schematic illustrating CRISPR-Cas9-mediated deletion strategy of LAMA1-associated PSSE to generate independent ∆LAMA1Enh hESC clones with different DNA cleavage products. (C) Flow cytometry analysis for NKX6.1 and PDX1 comparing control and ∆LAMA1Enh PP2 cells. Isotype control (ISO) for each antibody is shown in red and target protein staining in green. Percentage of cells expressing each protein is indicated (representative experiment, n = 3 independent differentiations). (D) Immunofluorescent staining for NKX6.1 and PDX1 in control and ∆LAMA1Enh PP2 cells (representative images, n = 2 slides). Scale bar, 50 μm. (E) mRNA expression of pancreatic transcription factors determined by RNA-seq in control and ∆LAMA1Enh PP2 cells. Data are shown as mean of fragments per kilobase per million fragments mapped (FPKM) ± S.E.M. (n = 2 replicates from independent differentiations for control cells. ∆LAMA1Enh cells represent combined data from two clonal lines with two replicates for each line from independent differentiations. p adj. = 3.56 × 10⁻², 0.224, 0.829, 8.14 × 10⁻², and 0.142, for comparisons of PDX1, NKX6.1, PROX1, PTF1A, and SOX9, respectively; DESeq2; * p adj. <0.05, n.s., not significant). (F) Similarity matrix showing Pearson correlations for normalized transcriptomes (log transformed expression for genes with FPKM ≥1 in ≥1 replicates) in control and ∆LAMA1Enh PP2 cells (n = 2 independent differentiations for control cells and for each ∆LAMA1Enh clone). See also Figure 4—source datas 1 and 2.
|