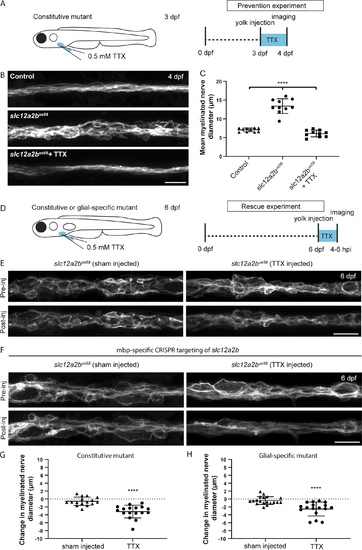
Neuronal activity drives peripheral nerve pathology in slc12a2b mutants. (A) Schematic overview of when, where and for how long TTX was applied to slc12a2bue58 mutants. (B) Confocal images of a Tg(mbp:EGFP-CAAX) control (top), slc12a2bue58 mutant (middle), and slc12a2bue58 mutant injected with TTX (bottom). Scale bar, 20 µm. (C) Quantitation of mean myelinated nerve diameter in controls, slc12a2bue58 mutants and slc12a2bue58 mutants injected with TTX (control 7.1 ± 0.5 µm vs. slc12a2bue58 13.4 ± 1.9 µm vs. slc12a2bue58+ TTX 6.1 ± 0.9 µm). Error bars represent mean ± SD. One-way ANOVA followed by Tukey’s multiple comparison test was used to assess statistical significance (ANOVA F(2,27) = 97, P < 0.0001). Each point represents an individual animal. ****, P < 0.0001. (D) Schematic overview of when, where, and for how long TTX was applied to either constitutive or glial-specific slc12a2b mutants. (E) Confocal images of 6 dpf slc12a2bue58 mutant larvae. Top and bottom panels show the same region of the pLLn before and 4–6 h after injection with either a control solution (left), or TTX (right). Scale bar, 20 µm. (F) Confocal images of 6 dpf Tg(mbp:EGFP-CAAX) larvae, in which slc12a2b has been targeted in myelinating glial cells. Top and bottom panels show the same region of the pLLn before and 4–6 h after injection with either a control solution (left) or TTX (right). Scale bar, 20 µm. (G) Quantitation of the change in mean myelinated nerve diameter following injection with either a control solution or TTX in slc12a2b mutants (G; sham injected −0.6 ± 1.1 µm vs. TTX −3.2 ± 1.6 µm, P < 0.0001) or animals in which slc12a2b has been disrupted specifically in myelinating glial cells (H; sham injected −0.4 ± 1 µm vs. TTX −2.5 ± 1.7 µm, P < 0.0001). Two-tailed Student’s t test was used to assess statistical significance. Each point represents an individual animal. ****, P < 0.0001.
|
