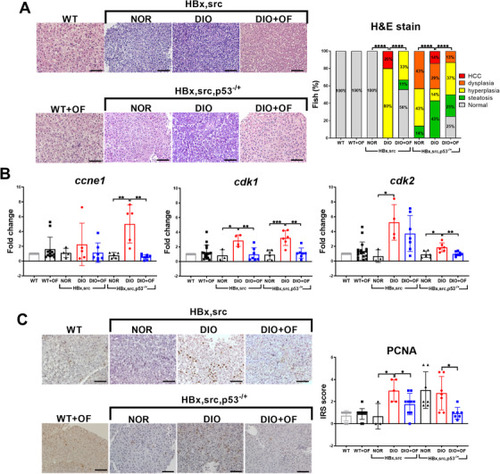
Oligo‐fucoidan pre‐treatment suppressed oncogene‐ and diet‐induced obesity‐mediated carcinogenesis in adult [HBx,src] and [HBx,src,p53−/+] transgenic zebrafish. A Representative H&E images show typical pathological tissue structures in hepatic tissues of [HBx,src] and [HBx,src,p53−/+] transgenic zebrafish that had been fed by normal diet (NOR, N > 4), diet‐induced obesity (DIO, N > 9), and DIO with OF (DIO+OF, N > 9). Both the non‐transgenic wild‐type control fish (WT) oral feeding with OF (WT+OF) show normal hepatocyte. The incidences of pathological alterations from two transgenic fish fed with distinct diets were shown as stacking bar chart. Statistical significance was calculated by chi‐square analysis (****P ≤ .0001). B, Analyses of mRNA levels of cell proliferation markers: ccne1, cyclin‐E1; cdk1, cyclin‐dependent kinase‐1; cdk2, cyclin‐dependent kinase 2 in [HBx,src] and [HBx,src,p53−/+] with normal diets (NOR), overfeeding (DIO), or DIO together with OF (DIO+OF), WT and WT+OF indicate non‐transgenic wild‐type fish without OF and with OF. Data are presented as dot plots. Statistical significance was calculated by t‐test (*P ≤ .05, **P ≤ .01, ***P ≤ .001). C, Representative proliferating cell nuclear antigen (PCNA) stain images in hepatic tissues of [HBx,src] and [HBx,src,p53−/+] transgenic zebrafish fed by different diets and OF. The corresponding immunoreactive scores (IRSs) of the PCNA staining were calculated by multiplying the staining intensity by the proportion of positive cells. Scale bars equal to 50 μm. Data are presented as dot plots. Statistical significance was calculated by t‐test (*P ≤ .05).
|
