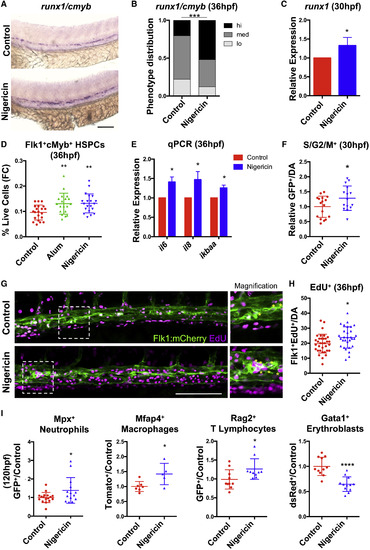
HSPC Production Is Enhanced by Inflammasome Activation (A) Expression of runx1/cmyb in the dorsal aorta of embryos with or without inflammasome stimulation (12?36 hpf) assessed by WISH. (B) Phenotype distribution plot of runx1/cmyb expression scored in embryos from (A) (n ? 59/condition). (C) runx1 qPCR in embryos with or without inflammasome stimulation (n = 4, mean �SEM). (D) Nigericin or Alum (12?36hpf) increased HSPCs by flow cytometry (FC). Significance was determined by ANOVA with Dunnett?s post-hoc test. Error bars indicate SD. (E) qPCR of IL1? target genes in embryos with or without inflammasome stimulation (n = 6, mean � SEM). (F) Relative numbers of S/G2/M+ cells in Tg(EF1a:mAG-zGem(1/100)) aortas with nigericin stimulation (12?30 hpf) (DA, dorsal aorta; fold change calculated within each clutch). (G) Imaging of Flk1+EdU+ cells in the DA region in 36 hpf Tg(flk1:mCherry) embryos labeled with EdU antibody. Asterisks in inset signify positive cells in the aortic floor. (H) Quantification of Flk1+EdU+ cells in the aortic floor of embryos from (G). Error bars indicate SD. (I) The proportion of Mpx+ neutrophils, Mfap4+ macrophages, Rag2+ lymphocytes, and Gata1+ erythroblasts in transgenic embryos was assessed with prolonged Nigericin stimulation (24?120 hpf) by flow cytometry. Error bars indicate SD. ?p < 0.05, ??p < 0.01, ????p < 0.0001. Scale bars, 100 ?m. See also Figure S4.
|
