
Figure 3
- ID
- ZDB-FIG-201012-67
- Publication
- Inaba et al., 2020 - Keratins and Plakin family cytolinker proteins control the length of epithelial microridge protrusions
- Other Figures
-
- Figure 1
- Figure 1—figure supplement 1.
- Figure 2
- Figure 3
- Figure 3—figure supplement 1.
- Figure 4
- Figure 4—figure supplement 1.
- Figure 4—figure supplement 2.
- Figure 4—figure supplement 3.
- Figure 4—figure supplement 4.
- Figure 4—figure supplement 5.
- Figure 4—figure supplement 6.
- Figure 4—figure supplement 7.
- Figure 5
- Figure 5—figure supplement 1.
- Figure 6.
- Figure 7.
- Figure 8.
- All Figure Page
- Back to All Figure Page
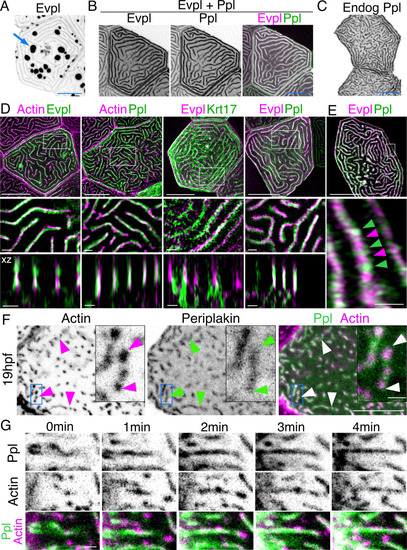
(A) Evpl-mRuby[BAC]-expressing periderm cells in 48hpf zebrafish show Evpl localization in aggregates (e.g. arrow) and microridges. (B) Evpl-mRuby[BAC] and Ppl-GFP[BAC] co-expression in a periderm cell at 48hpf. (C) Endogenously GFP-tagged Ppl in periderm cells at 48hpf. (D) Projection and orthogonal views of SIM images of the indicated co-expressed reporters. White boxes, regions of magnification in middle panels. Bottom panel, orthogonal view (apical up, basal down). (E) Confocal Airyscan image of cells expressing Ppl-GFP[BAC] and Evpl-mRuby[BAC]. White box, region of magnification in lower panel. Arrowheads show alternating arrangement of Ppl and Evpl in microridges. (F) Ppl-GFP[BAC] and Lifeact-mRuby expression in a 19hpf periderm cell. Arrowheads point to representative areas in which Ppl localizes to longer structures than actin pegs. Boxes, area of magnification for insets. (G) Sequential projections from a time-lapse movie of Ppl-GFP[BAC]- and Lifeact-mRuby-expressing periderm cells at the end of cytokinesis (24hpf). Note that Ppl structures appear to precede F-actin in developing protrusions. Black-and-white images were inverted so that high-intensity fluorescence appears black and low-intensity fluorescence is white. Scale bars: 10 µm (A–F) and 1 µm (zoomed and orthogonal views in D, F, and G). |