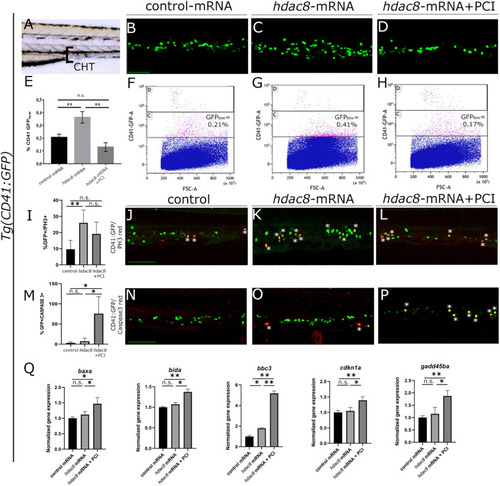
Analysis of Hdac8 overexpression in zebrafish and apoptosis induced by PCI treatment. (A) Scheme of trunk-tail region of zebrafish embryos: confocal imaging was always performed on the same embryo region, comprising the tip of the yolk sack extension, between the dorsal aorta and the vein; representative images of (B) control; (C)hdac8-mRNA injected; (D) PCI-treated hdac8-mRNA injected Tg(CD41:GFP) zebrafish embryos at 3 dpf. Scale bar represents 100 μm. (E) Quantification by FACS of GFPlow-HSPCs of (F) control; (G)hdac8-mRNA injected; (H) PCI-treated hdac8-mRNA injected Tg(CD41:GFP) zebrafish embryos at 3 dpf. The results are presented as mean ± SD from three independent experiments. (I–L) Proliferation of HSPCs in the caudal hematopoietic tissue of the Tg(CD41:GFP) zebrafish line following Hdac8 overexpression and PCI treatment. GFP+ HSPCs in green; PH3 in red; quantification in (I), N = 6 embryos analyzed. (M–P) Apoptosis of HSPCs in the caudal hematopoietic tissue of the Tg(CD41:GFP) zebrafish line following PCI treatment. GFP+ HSPCs in green; activated caspase-3+ cells in red; quantification in (M), N = 3 embryos analyzed. Asterisks indicate double positive cells (yellow). Scale bar represents 100 μm. (Q) RT-qPCR analyses of apoptotic markers baxa, bida, bbc3, cdkn1a, and gadd45ba expression in control mRNA and hdac8-overexpressing zebrafish embryos treated with DMSO or PCI. The results are presented as mean value ± SD from three independent experiments. *p < 0.05, **p < 0.01, n.s. = not significant, one-way ANOVA followed by Tukey post hoc correction.
|
