
Fig. 4
- ID
- ZDB-FIG-200924-41
- Publication
- Lv et al., 2020 - Generation of foxn1/Casper Mutant Zebrafish for Allograft and Xenograft of Normal and Malignant Cells
- Other Figures
- All Figure Page
- Back to All Figure Page
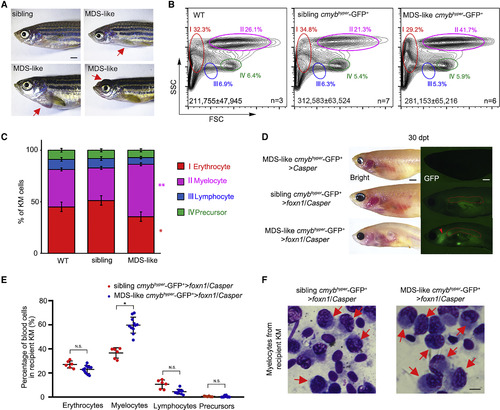
Allogeneic MDS-like Cell Transplantation with Tg (cmybhyper:GFP) (A) The pathologic external features of zebrafish Tg (cmybhyper:GFP). Some of the transgenic zebrafish display MDS-like phenotypes (exophthalmos, cachexia, and abdominal mass). The red arrows denote diseased areas. Scale bar, 1 mm. (B) Flow-cytometric analysis of 24-month-old WT (no transgenic background) and Tg (cmybhyper:GFP) KM. The representative percentages of myelocytes in WT, siblings, and MDS-like zebrafish are indicated. Total cell numbers in whole KM are indicated (mean � SD; n [WT] = 3, n [siblings] = 7, n [MDS-like zebrafish] = 6). (C) Statistical analysis of the percentage of different blood lineages in (B) (mean � SD, one-way ANOVA, Tukey's; ?p < 0.05, ??p < 0.01, n [WT] = 3, n [siblings] = 7, n [MDS-like zebrafish] = 6). (D) Direct observation of engrafted MDS-like cells. At 30 dpt, MDS-like cmybhyper-GFP+ cells could be visualized in foxn1/Casper recipient KM, not in the Casper. The red dashed lines indicate the KM regions. The red arrow indicates the engrafted MDS-like cmybhyper-GFP+ cells in the head. n (Casper) = 0/10, n (foxn1/Casper) = 9/12. Scale bar, 1 mm. (E) Statistical analysis of the percentage of different blood lineages in MDS-like and sibling cmybhyper-GFP+ cell-engrafted KMs. The cmybhyper-GFP+ cells in recipient KM were gated for analysis (mean � SD, t test; N.S., non-significant; ?p < 0.05; n > 3 in each group). (F) Wright-Giemsa staining of blood cells in recipient KM after MDS-like and sibling cmybhyper-GFP+ cell transplantation. The red arrows indicate the MDS-like myelocytes in recipients. Scale bar, 5 ?m. |