|
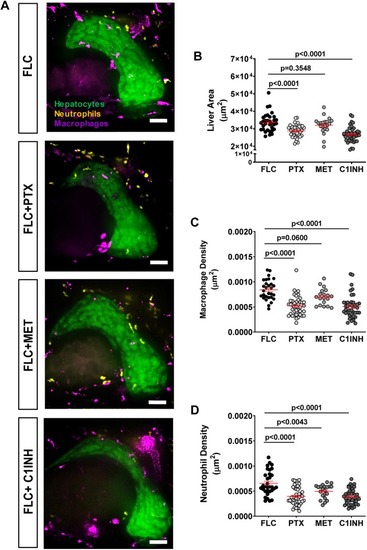
Pharmacological inhibition of TNFα secretion and Caspase-a activity reduces inflammation and FLC progression. (A) Representative MIPs of 7 dpf FLC larvae [Tg(fabp10a:dnajb1a-prkacaa)/Tg(fabp10a:egfp-l10a)/Tg(lyzc:bfp)/Tg(mpeg1:mCherry-caax)] and control siblings [Tg(fabp10a:egfp-l10a)/Tg(lyzc:bfp)/Tg(mpeg1:mCherry-caax)] treated with 50 μM pentoxifylline (PTX), 50 μM metformin (MET) and 100 μM Ac-YVAD-CMK (C1INH). (B-D) Graphs showing liver area (B) (control N=32, PTX N=42, MET N=21, C1NH N=46), macrophage density (C) (control N=29, PTX N=42, MET N=19, C1NH N=42) and neutrophil density (D) (control N=32, PTX N=42, MET N=21, C1NH N=46). Scale bars: 40 μm. Data are from at least three independent experiments. Analysis performed in EMM in R. Dot plots show mean±s.e.m.; P-values are shown on graphs.
|