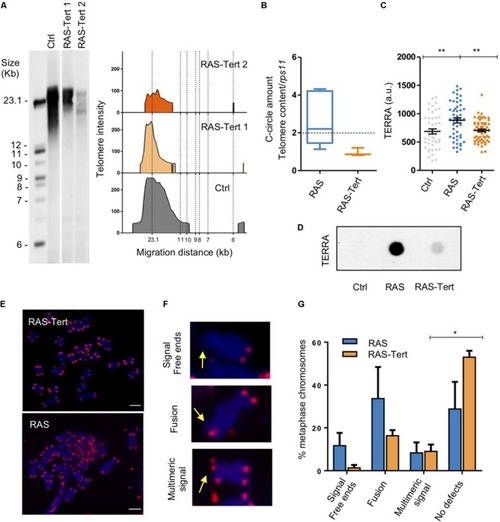
Expression of tert prevents the development of ALT and reduce genome instability in brain tumors. (A) Telomere length analysis by TRF in one control and two RAS-Tert tumors. The panel on the right shows TFR analysis obtained by graphing intensity versus DNA migration. The southern blot was sliced for better fitting. (B) C-Circle assay quantified by telomere qPCR in RAS and RAS-Tert tumors. Data are represented as C-Circle amount normalized to telomere content (TC) and single copy gene (rsp11). RAS n = 7; RAS-Tert n = 3. The dashed line indicates the level above which ALT activity is considered significant. Whiskers box plots represent median: min to max values. (C) Scatter plot of TERRA RNA-FISH signals measured as fluorescent intensity of single spots per nucleus in Control (n = 46), RAS (n = 50), and RAS-Tert (n = 62) cell nuclei from brains and brain tumors. Data from a single, representative experiment are shown (**p < 0.01). Bars represent mean ± SEM. (D) TERRA RNA dot blot from total RNA of control, RAS and RAS:Tert brains. 500 ng of total RNA was spotted for all samples. (E) Metaphase DNA FISH analysis using telomeric repeat probes of Tert-RAS and RAS juvenile brain tumors. Telomeric DNA (magenta), metaphase chromosomes, blue, and (F) magnified examples of aberrant telomere phenotype, signed by arrows: Signal free ends, fused telomeres, multimeric signal. (G) Quantitation of telomeric defects revealed in RAS (n = 95 chromosomes) and RAS-tert (n = 68 chromosomes) tumors. Multiple t-test, Holm Sidak methods, *p < 0.05. Bars represent mean ± SEM.
|
