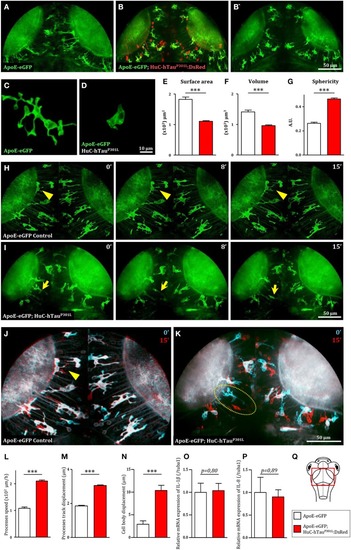
Microglia displays dramatic changes in morphology and dynamics in the presence of hTauP301L-expressing neurons. (A,B,B') Dorsal views of the optic tectum of 7 dpf Tg(ApoE-eGFP) (A) and Tg(ApoE-eGFP; HuC-hTauP301L:DsRed) transgenic embryos (B,B'), showed the characteristic ramified morphology of microglia in wild-type (A), while in the presence of hTauP301L-expressing neurons, microglial cells displayed shorter processes and larger cell bodies. (C,D) Detailed morphology of microglial cells in Tg(ApoE-eGFP) (C) and Tg(ApoE-eGFP; HuC-hTauP301L:DsRed) embryos (D). (E–G) Measurements of microglia morphological parameters; surface area (E, p < 0.0001), volume (F, p < 0.0001), and sphericity (G, p < 0.0001), in Tg(ApoE-eGFP) (n = 10) and Tg(ApoE-eGFP; HuC-hTauP301L:DsRed) (n = 24) embryos, confirmed the cell shape changes observed in the presence of hTauP301L-expressing neurons. (H,I) Time-lapse sequences of microglia dynamics in Tg(ApoE-eGFP) (H, Supplementary Video 1) and Tg(ApoE-eGFP; HuC-hTauP301L:DsRed) embryos (I, Supplementary Video 2). (J,K) Merged images of two time points separated by 15 min from Supplementary Video 1(J) and Supplementary Video 2(K). The merged images at t = 0 min (cyan) and t = 15 min (red) highlighted the dramatic increased mobility of microglial cell bodies in the presence of hTauP301L-expressing neurons. (L–N) Measurements of microglia dynamics; process speed (L, p = 0.0004), process track displacement (M, p = 0.0002) and cell body displacement (N, p = 0.0054), in Tg(ApoE-eGFP) (n = 3) and Tg(ApoE-eGFP; HuC-hTauP301L:DsRed) (n = 4) embryos, confirmed the increased mobility of both microglia processes and cell bodies observed in the presence of hTauP301L-expressing neurons. (O,P) Measurements of pro-inflammatory cytokine expression in the brain of 5 dpf Tg(ApoE-eGFP) (n = 6) and Tg(ApoE-eGFP; HuC-hTauP301L:DsRed) (n = 11) embryos. Comparison of the relative expression of IL-1β (O, p = 0.80) and IL-8 (P, p = 0.89) in both groups shows no significant differences. (Q) Schematic dorsal view of a 7 dpf zebrafish embryo. The red square shows the region of interest that comprises the optic tectum. ***p < 0.001. Scale bar (A,B,B',H–K) = 50 μm, (C,D) = 10 μm. A.U., arbitrary units.
|
