
Fig. 1
- ID
- ZDB-FIG-191115-1
- Publication
- Elbialy et al., 2018 - A Zebrafish Acromegaly Model Elevates DNA Damage and Impairs DNA Repair Pathways
- Other Figures
- All Figure Page
- Back to All Figure Page
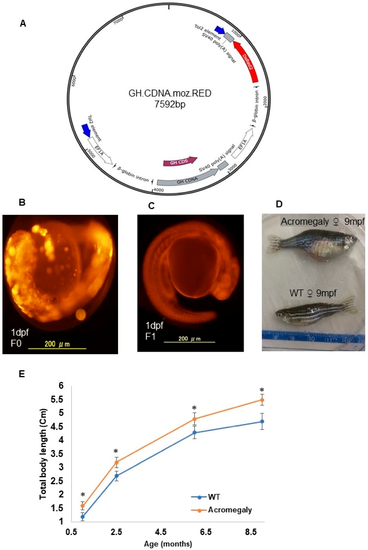
Production of the acromegaly zebrafish model overexpressing tilapia GH. ( A) The structure of the GH-CDNA-moz-RED construct used to produce acromegaly zebrafish. The blue arrows indicate Tol2 transposable element. EF1A promoters drive expression of Tilapia GH cDNA and DsRed2 CDS. ( B) Acromegaly zebrafish F0 generation larvae (1 dpf) showing mosaic expression of red fluorescent protein (RFP) reporter gene expression. ( C) Acromegaly zebrafish F1 generation larvae (1 dpf) showing homogenous expression of red fluorescent protein (RFP) reporter gene expression in the whole body. ( D) Representative female acromegaly zebrafish F1 generation (9 mpf) showing a progressive increase in growth rate compared to wild-type (WT). ( E) Shown are growth curves represented as the total body length of fish recorded from one month till nine months of age between eight F1 Acromegaly zebrafish (four males and four females) and eight WT zebrafish (four males and four females). Data are expressed as the mean � SE (n = 8). Statistical differences (t-test, P < 0.05) are denoted by asterisks. dpf: days post-fertilization, mpf: months post-fertilization. |