
Fig. 3
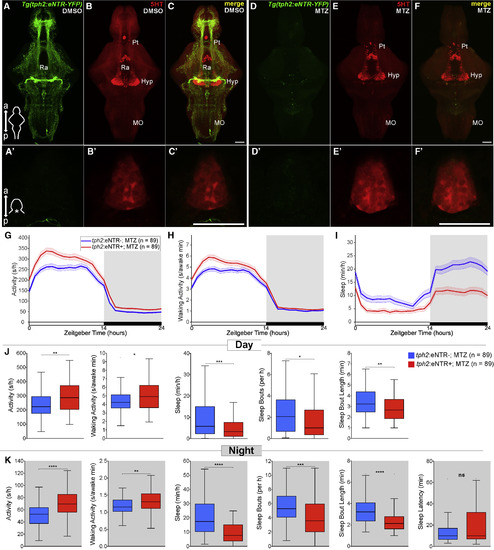
Chemogenetic Ablation of the Raphe Results in Decreased Sleep in Zebrafish (A–F′) Maximum intensity projections of brains (A–F) and single plane images of pineal glands (A′–F′) from 5 dpf Tg(tph2:eNTR-YFP) zebrafish treated with DMSO vehicle (A–C and A′–C′) or MTZ (D–F, D′–F′), and immunostained for 5-HT and YFP. Scale bars, 50 μm. a, anterior; p, posterior; Pt, pretectal area; Hyp, hypothalamus; Ra, raphe; MO, medulla oblongata. (G–I) Activity (G), waking activity (H), and sleep (I) for 5 dpf Tg(tph2:eNTR-YFP) (red) and non-transgenic sibling control (blue) zebrafish treated with MTZ. Line and shading represent mean ± SEM. (J and K) Activity, waking activity, sleep, sleep bout number, sleep bout length during day (J) and night (K), and sleep latency at night (K). n, number of animals. ns p > 0.05, ∗p < 0.05, ∗∗p < 0.01, ∗∗∗p < 0.001, ∗∗∗∗p < 0.0001, Mann-Whitney test. |
| Gene: | |
|---|---|
| Antibody: | |
| Fish: | |
| Condition: | |
| Anatomical Terms: | |
| Stage: | Day 5 |
| Fish: | |
|---|---|
| Condition: | |
| Observed In: | |
| Stage: | Day 5 |