
Fig. 5
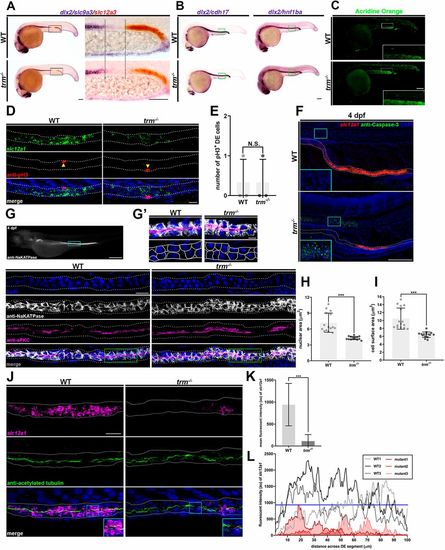
tfap2a is essential for the induction of terminal differentiation in the distal nephron. (A,B) Whole-mount in situ hybridization for indicated markers. Black dotted lines indicate the area with DE progenitors. Green boxes specify continuous expression of tubule markers in DE. Scale bars: 70?µm. (C) Acridine Orange staining. The white box indicates the optical zoom of a distal nephron. Scale bar: 70?µm. (D) Fluorescent in situ hybridization with immunofluorescence. Yellow arrowheads represent pH3+/slc12a1+ cells. White dots outline the pronephros. Scale bar: 10?µm. (E) Quantification of pH3+ DE cells. (F,G) Fluorescent in situ hybridization with immunofluorescence at 4 dpf. Cyan boxes indicate notochord in insets. Scale bar: 100?µm. (G) Cyan box indicates regions shown underneath. Gray dots border tubule. Green boxes indicate regions featured in G′. Scale bar: 10?µm. (G′) Optical zoom of regions highlighted in G. Bottom panels depict the strategy used to trace Na,K-ATPase expression to score cell morphology. Scale bar: 5?µm. (H) Quantification of nuclear area. (I) Quantification of cell surface area. (J) Fluorescent in situ hybridization with immunofluorescence. White dots line nephron limits. Cyan box indicates inset (optical zoom). Scale bar: 10?µm. (K) Quantification of mean fluorescent intensity (au) from three mutant and three wild-type samples across a 100?µm distance within the DE. (L) Fluorescent intensity plot of three wild-type individuals (grayscale) and three mutant individuals (red). Blue line indicates the threshold value (au) of wild-type slc12a1 transcripts. n≥3. ***P<0.001; N.S., not significant. Data are mean±s.d. Cell counts, area measurements and fluorescent intensity (au) analyzed using unpaired t-tests. |
| Genes: | |
|---|---|
| Antibodies: | |
| Fish: | |
| Anatomical Terms: | |
| Stage Range: | Prim-5 to Day 4 |