
Fig. 4
- ID
- ZDB-FIG-190909-1
- Publication
- Wang et al., 2019 - Abnormal Behavior of Zebrafish Mutant in Dopamine Transporter Is Rescued by Clozapine
- Other Figures
- All Figure Page
- Back to All Figure Page
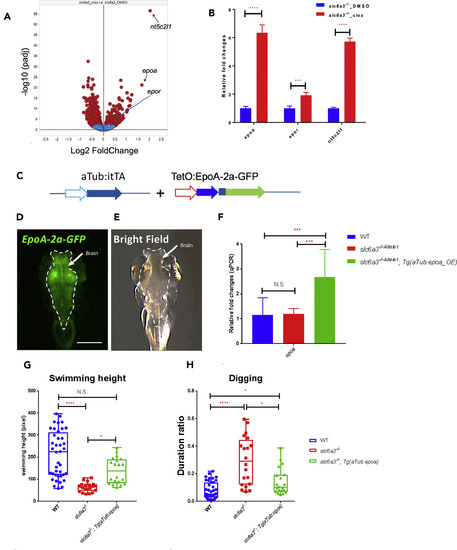
RNA-Seq Analysis Reveals Erythropoietin Pathway as a Potential Clozapine Target (A) The volcano plot of log2-fold change of gene expression in the adult fish brain between the treatments of clozapine and DMSO in slc6a3−/− allele1. The clozapine highly upregulated genes (epoa, epor, and nt5c2l1) are indicated on the graph. (B) Bar plot of gene expression of epoa, epor, and nt5c2l1 by RNA-seq analysis. ****p < 0.0001, ***p < 0.001. n = 8 for all. Error bar = standard deviation. Significance test: Wilcoxon-Mann-Whitney test. (C) The construct maps for over-expression of epoa in neurons with the tetracycline-controlled transcriptional activation system. (D and E) The dorsal view of the green channel (D) and bright field (E) of a slc6a3−/−_allele1; Tg(aTub:iTTA; TetO:EpoA-2a-GFP) fish at 5 days post-fertilization under a fluorescent dissecting microscope. The brain area (indicated by green fluorescence in D) is outlined by a dotted line. Scale bar, 250 μm. (F) Whole-brain qRT-PCR at 2 months post-fertilization confirms the upregulation of epoa in the slc6a3−/−_allele1;Tg(aTub:iTTA; TetO:EpoA-2a-GFP) fish. Error bar, standard deviation. n = 6 for all conditions. ***p < 0.001, **p < 0.01, N.S., no significance. Significance test, Wilcoxon-Mann-Whitney test. (G and H) The quantification of The quantification of average swimming height (G) and duration of “digging” feature (H) of slc6a3−/−_allele1; Tg(aTub:iTTA; TetO:EpoA-2a-GFP) compared to slc6a3−/−_allele1 and wild-type at 2 months post-fertilization. nWT = 40, nslc6a3−/−_allele1_ = 20, nslc6a3−/−_allele1; tg(aTub:eopa) = 20. ∗∗∗∗p < 0.0001, ∗p < 0.05, N.S., no significance. Significance test: one-way ANOVA Kruskal-Wallis test. |
| Gene: | |
|---|---|
| Fish: | |
| Anatomical Term: | |
| Stage: | Days 45-89 |
| Fish: | |
|---|---|
| Observed In: | |
| Stage: | Days 45-89 |