
Fig. 2
- ID
- ZDB-FIG-190821-8
- Publication
- Voltes et al., 2019 - Yap/Taz-TEAD activity links mechanical cues to progenitor cell behavior during zebrafish hindbrain segmentation
- Other Figures
- All Figure Page
- Back to All Figure Page
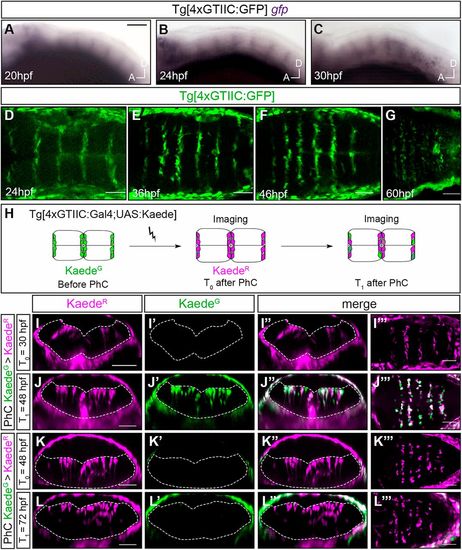
Onset/offset of Yap/Taz-TEAD activity in the hindbrain boundaries. (A-C) Tg[4×GTIIC:GFP] embryos at the indicated stages assayed for a whole-mount in situ hybridization using a gfp RNA probe. Expression of gfp, and therefore Yap/Taz-activity, is already visible in the boundaries at 20?hpf. Lateral views with anterior to the left. (D-G) Expression of GFP in the hindbrain boundaries in Tg[4xGTIIC:GFP] embryos at the indicated stages. GFP is first observed at 25?hpf. GFP expression persists for up to 72?hpf (data not shown). Dorsal views with anterior to the left. (H) Scheme depicting the photoconversion experiment: KaedeG in the hindbrain boundary cells of Tg[4xGTIIC:Gal4FF;UAS:KAEDE] embryos was photoconverted to KaedeR at T0, and embryos were allowed to develop up to the desired stage (T1). (I-I″,J-J″) Embryo in which KaedeG was photoconverted to KaedeR at T0=30?hpf (I-I″) and which was analyzed at T1=48?hpf (J-J″). New KaedeG is generated in cells between 30?hpf and 48?hpf (see merged channels in J″,J?). (K-L″) Embryo in which KaedeG was photoconverted to KaedeR at T0=48?hpf (K-K″) and which was further analyzed at T1=72?hpf (L-L″). No new KaedeG-expressing cells were observed after photoconversion (L-L?), suggesting that the decline of Yap/Taz-activity was before 48?hpf. (I-I″,J-J″,K-K″,L-L″) Reconstructed transverse sections of embryos are displayed in I?,J?,K?,L? as dorsal views with anterior to the left. Scale bars: 30 μm in A-C; 50 μm in D-G,I-L″′. |
| Genes: | |
|---|---|
| Fish: | |
| Anatomical Term: | |
| Stage Range: | 20-25 somites to Protruding-mouth |