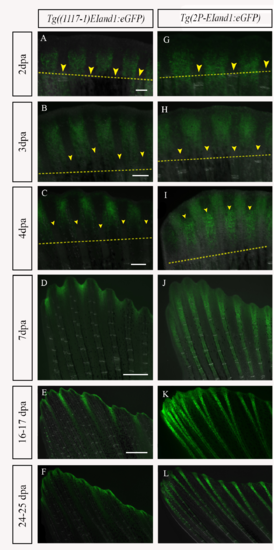
Fig. S3
|
Time course analysis of Tg((1117–1)EIand1:eGFP) and Tg(2P-EIand1:eGFP)throughout regeneration.In vivo time course analysis of reporter expression of Tg(2P-EIand1:eGFP) (n = 12) (A-F) and Tg((1117–1)EIand1:eGFP) (n = 5) (n = 25 fish/line, 2 lines) (G-L) during fin regeneration. (A-B, G-H) At 2dpa and 3dpa, reporter expression is brightly observed only in interray tissue of Tg(2P-EIand1:eGFP) and Tg((1117–1)EIand1:eGFP). (C-D) At 4dpa and 7dpa, fin ray mesenchymal-specific reporter expression occurs along the proximal-distal axis and is as equally bright as that of interray-specific expression in Tg(2P-EIand1:eGFP), which occurs at the distal region of the regenerate. (E-F) Fin ray-specific reporter expression begins to distally restrict in Tg(2P-EIand1:eGFP). (I-J) Reporter expression only occurs in interray of Tg((1117–1)EIand1:eGFP) and always remains confined within the distal region of regenerate. (K-L) reporter expression occurs in the interray and distal edge of the fin in Tg((1117–1)EIand1:eGFP). Scale bar: A, G = 100μm, B, H = 200μm, C, I = 200μm, D, J = 200μm, E-F, K-L = 200μm. (Images in panels A-F have been reused from Fig 3.4. for better comparison of eGFP expression.) |

