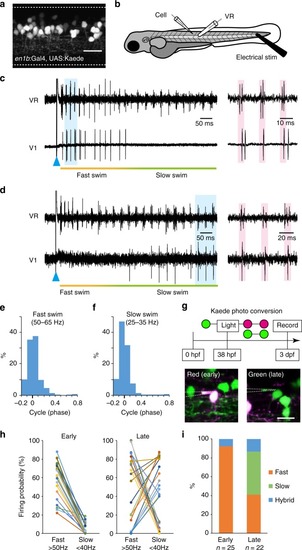
Firing patterns of V1 neurons in larval zebrafish. a A side view of the compound transgenic fish of Tg[en1b:Gal4] and Tg[UAS:Kaede]. The dashed lines indicate boundaries of the spinal cord. Scale bar, 20 μm. b A schematic illustration of the simultaneous recordings of a V1 neuron (loose-patch) and ventral root (VR). Fictive swimming was elicited by applying brief electrical stimulation near the tail. c An example of the recordings from the fast-type V1 neurons. The blue arrowhead shows the time point of electrical stimulation. In the right panel, the region shadowed in blue in the left panel is enlarged. d An example of the recordings from the slow-type V1 neurons. e Histogram of spike timings of fast-type V1 neurons during fast (50–65 Hz) swim (1387 swimming cycles from 29 cells). f Histogram of spike timings of slow-type V1 neurons during slow (25–35 Hz) swim (5782 swimming cycles from 10 cells). g Schematic diagram of the Kaede photo-conversion experiment (top). The bottom two panels show the recordings from early-born V1 neurons (red Kaede [shown in magenta], left) and late-born V1 neurons (green Kaede, right). Scale bar, 10 μm. h Firing probability of early-born V1 neurons (left, n = 25) and late-born V1 neurons (right, n = 22) in each cycle during fast (>50 Hz) and slow (<40 Hz) swim. Each colored circle represents each recorded cell. i Classification of the recorded V1 neurons. Out of the 25 early-born V1 neurons, n = 23 for fast-type and n = 2 for hybrid-type. Out of the 22 late-born V1 neurons, n = 9 for fast-type, n = 10 for slow-type, and n = 3 for hybrid-type. If the value of the firing probability during fast swim was more than double that during slow swim, the cell was considered a fast-type (and vice versa). If the difference was within the doubled value, the cell was considered a hybrid-type
|
