
FIGURE
Figure 2
- ID
- ZDB-FIG-190723-1887
- Publication
- Mullapudi et al., 2018 - Screening for insulin-independent pathways that modulate glucose homeostasis identifies androgen receptor antagonists
- Other Figures
- All Figure Page
- Back to All Figure Page
Figure 2
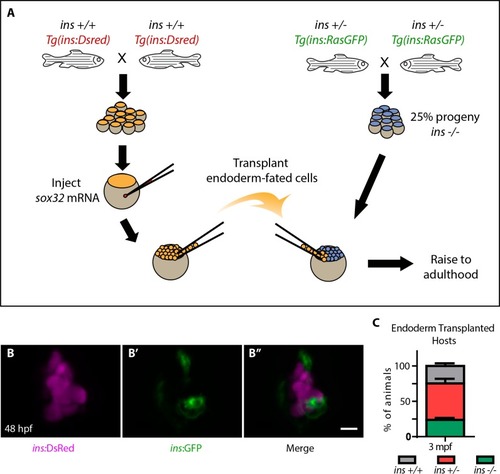
(A) Schematic depicting the endoderm transplantation protocol; sox32 mRNA-injected ins +/+ donor cells (orange) were transplanted into host embryos (blue) to form chimeric animals. (B–B’’) Confocal projection images of the pancreatic islet of a 48 hpf chimeric animal showing β-cells from the host (green, (B’) and the transplanted ins +/+ cells (magenta, (B). (C) Genotype distribution in the raised three mpf chimeric animals, determined by genotyping fin tissue; mean ± SEM, n = 3 transplant experiments, 18–32 animals per experiment. Scale bar: 10 μm. |
Expression Data
Expression Detail
Antibody Labeling
Phenotype Data
Phenotype Detail
Acknowledgments
This image is the copyrighted work of the attributed author or publisher, and
ZFIN has permission only to display this image to its users.
Additional permissions should be obtained from the applicable author or publisher of the image.
Full text @ Elife