Fig. 6
- ID
- ZDB-FIG-190718-38
- Publication
- Kamieniarz-Gdula et al., 2019 - Selective Roles of Vertebrate PCF11 in Premature and Full-Length Transcript Termination
- Other Figures
- All Figure Page
- Back to All Figure Page
|
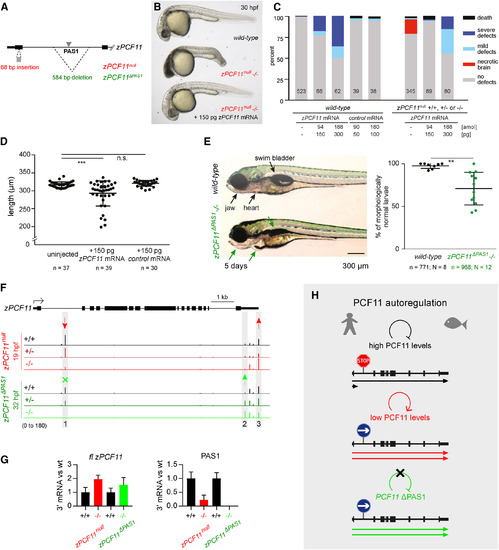
Zebrafish PCF11 Is Essential for Development and Undergoes PAS1-Dependent Autoregulation (A) Schematic of zebrafish zPCF11null and zPCF11ΔPAS1mutants. First two exons of zPCF11 are shown. (B) Severe brain necrosis of zPCF11null−/− embryos is rescued by injection of 150 pg of zPCF11 mRNA at the 1-cell stage. (C) Quantification of rescue and overexpression phenotypes upon zPCF11 mRNA injection. Embryos were scored at 1 day. The numbers within bars indicate number of embryos scored in each treatment group. (C and D) Control mRNA: GFP-Bouncer (Herberg et al., 2018). (D) Quantification of decrease in body length at 2 days upon overexpression of zPCF11 mRNA. Example images of larvae are shown in Figure S6F. (E) Phenotypes observed in zPCF11ΔPAS1−/− larvae at 5 days. (left) Example images; (right) quantification of morphological defects (lack of swim bladder, heart edema, jaw malformations). n = total number of embryos, N = number of independent crosses. (D and E) Significance determined by unpaired two-tailed t test. (F) 3′ mRNA-seq profiles of the zPCF11 gene for the indicated genotypes (red: siblings derived from zPCF11null+/− incrosses; green: siblings derived from zPCF11ΔPAS1+/− incrosses). Average values of 3–6 biological replicates (individual embryo heads, see Figure S6H). Arrows and gray shading indicate significantly altered PAS usage (DEXseq padj < 0.05). (G) Quantification of fl zPCF11 mRNA (left) and PAS1 usage (right) in indicated mutants relative to the corresponding wild-type. 3′ mRNA-seq was used for quantification (n > = 3). Error bars correspond to SD. (H) Model of PCF11 autoregulation in human and zebrafish. (top) When PCF11 protein levels are high, PCF11transcription is partially attenuated by PAS1 usage and premature termination; as a result, only a fraction of transcripts are full-length. (middle) When PCF11 protein levels are low, PAS1 usage drops leading to more full-length PCF11 mRNA formation. (bottom) PAS1 removal leads to increased full-length mRNA and protein production. |
| Fish: | |
|---|---|
| Observed In: | |
| Stage Range: | Prim-15 to Adult |

